Stocks Stealth Bull Market Trend Forecast For 2010
Stock-Markets / Stocks Bull Market Feb 02, 2010 - 07:52 AM GMTBy: Nadeem_Walayat
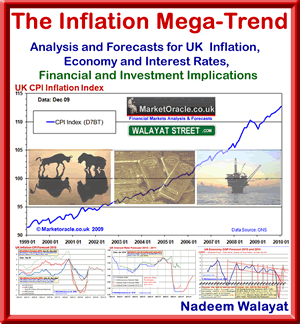
 This analysis is part of the New Inflation Mega-trend Ebook, the analysis for which has been compiled during the past 3 months which concluded in trend forecasts for inflation, economy and interest rates for 2010 and beyond. The implications of which have been applied towards finance and investment markets for 2010 and beyond. To receive the ebook for FREE as it is rolled out over the coming week(s) as well as updates throughout the year ensure you are subscribed to my always free newsletter.
 This article shares the inflation mega-trend analysis implications for the Dow Jones Industrial Averages stock market index, with the conclusions also applied to the FTSE 100 index. The reason why my analysis is focused on the Dow and not the FTSE is because the Dow has been my primary trading vehicle for some 25 years, as at the start of my trading career back in 1986 the FTSE was the new kid on the block with little price history behind it, whereas the DJIA had relatively easily obtainable data dating back over a hundred years (via bulletins boards, a precursor for the internet).
Whilst this analysis attempts to accurately project a road map trend for the Dow for the whole of 2010, however readers should ensure that they read my regular in depth updates on the Dow trend (approximately every 2 months) which are emailed out and also at walayatstreet.com
2009 The Year of the Stocks Stealth Bull Market
For stock market Investors and traders there were two key events during the year.
1. The Stocks Bear Market Bottom of early March 2009 (Dow 6470).
2. The birth of the Stocks Stealth Bull Market that saw many indices soar by more than 60% over the next 9 months.
The primary purpose of analysis is to generate market scenario's that have a high probability of success for the primary purpose of monetizing on these trends that are usually contrary to the consensus view.
In this regard the stock market bottom of early March fulfills this as the whole subsequent rally has been called by the vast majority of analysts across the board a bear market rally to SELL into, virtually every correction has been followed by calls that the market has topped and the resumption of bear market lows as imminent. The most notable crescendo of the crash is coming calls was during the October correction when widespread commentary spread forth of an imminent crash that AGAIN FAILED to materialise.
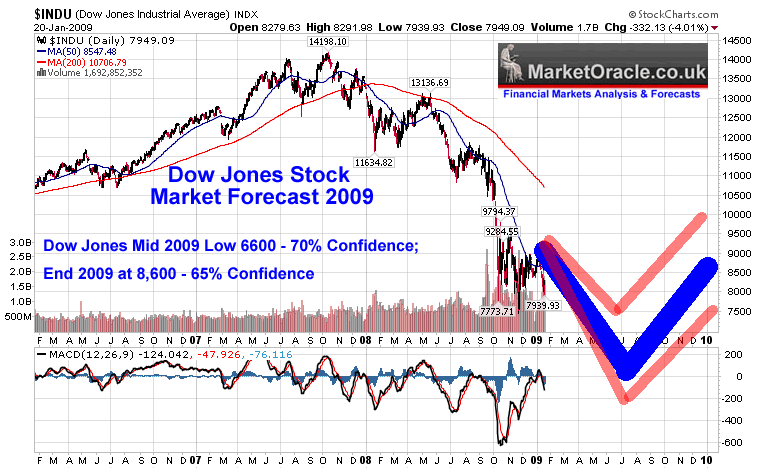
Dow Jones Stock Market Forecast 2009 - 20th Jan 2009
Dow Jones Mid 2009 Low 6600 - 70% Confidence; End 2009 at 8,600 (During December 2009) - 65% Confidence
Stealth Bull Market Follows Stocks Bear Market Bottom at Dow 6,470 - 14th March 2009
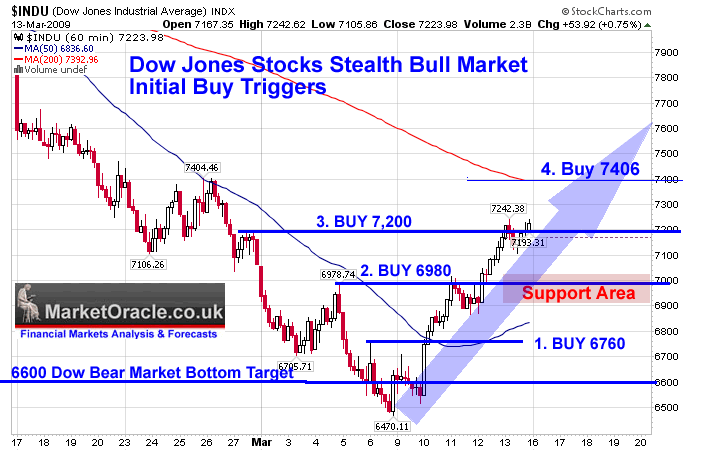
Now watch ! How this STEALTH bull market will consistently be recognised as just a bear market rally to sell into and NOT to accumulate into. All the way from 6,600 to 7,600 to 8,600 and even beyond, the move will be missed by most as consistently bearish rhetoric and data will ensure only the smart money accumulates, for the small investor has now become Conditioned to the Bear Market Rallies of 20% and subsequently plunges to fresh lows. Many, many months from now, with stocks up 30%, investors will then WAIT for THE BIG CORRECTION, THE RE-TEST to buy into the apparent BULL Market , Well these investors will still be waiting as stocks pass the 50% advance mark, AGAIN only those that will have profited are the hedge funds and fund investors (Smart Money) WHO HAVE BEEN ACCUMULATING , as I elaborate upon next.
In Summary - We have in all probability seen THE stocks bear market bottom at 6470, which is evident in the fact that few are taking the current rally seriously instead viewing it as an opportunity to SELL INTO , Which is exactly what the market manipulators and smart money desires. They do not want the small investors carrying heavy losses of the past 18 months to accumulate here, No they want the not so smart money to SELL into the rally so that more can accumulated at near rock bottom prices! Therefore watch for much more continuous commentary of HOW this is BEAR MARKET RALLY THAT IS TO BE SOLD INTO as the Stealth Bull Market gathers steam.
Stealth Stocks Bull Market, Sell in May and Go Away? - 26th April 2009
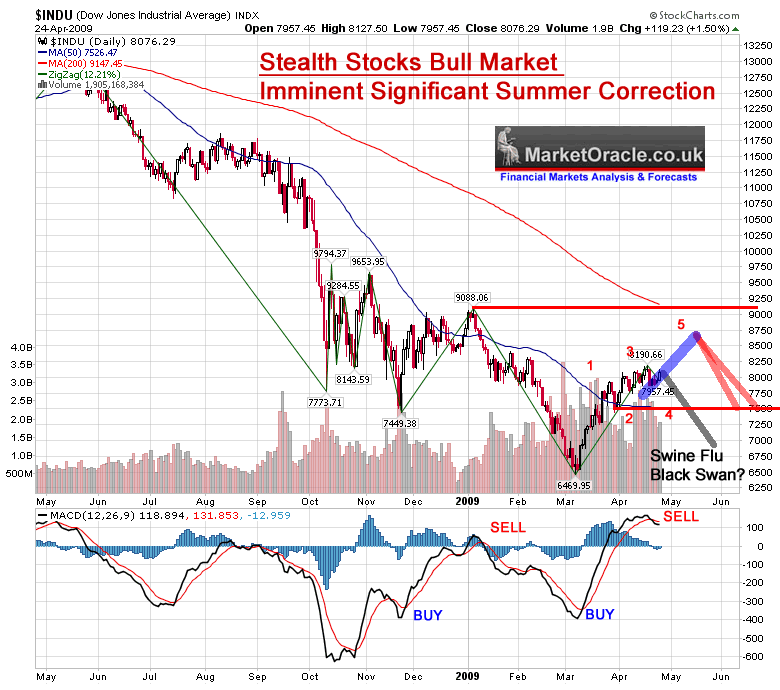
Conclusion - Immediate term conflicting analysis, will there be a continuing rally into early May or not ? Clearly early week will be weak and a lot now depends on whether the support of 7,800 holds, the 280 point gap between the last close and support should give the market plenty of swine flu room to breath, it is a tough call but after that early week wobble, I would go with a continuation into early May to set up for the main move which is for the significant correction that targets a decline of about 14% or Dow 7,500 from 8750. If 7800 fails early week that implies Dow 7,100. So just as the herd is starting to pile in the smart money will be positioning for a significant correction and importantly the move will be TRADEABLE, none of these 1 or 2 day falls that have suckered the bears in during the rally, but for a sustained down trend though swine flu may bring this forward to the start of the week. Note this is an interim update, my in depth analysis will attempt to more accurately map out the Dow swings of several months so make sure your subscribed to my always FREE newsletter to get this on the day of publication.
Vicious Stocks Stealth Bull Market Eats the Bears Alive!, What's Next? - 23rd July 2009
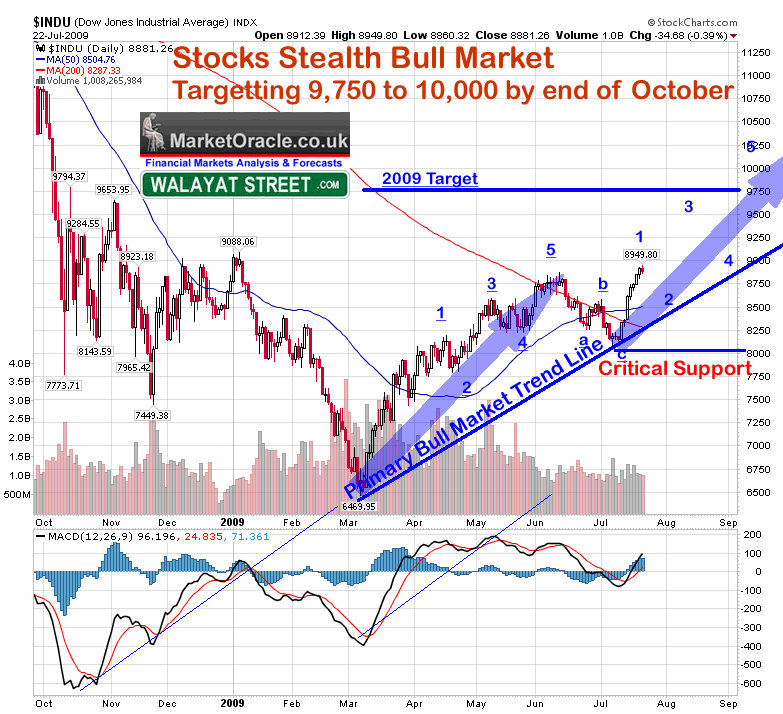
CONCLUSION - My earlier fears about a bull trap appear to be unfounded, the stock chart is talking that we are in a stocks bull market, and is suggestive of a trend higher towards a 2009 target of between 9750 and 10,000, with a high probability that we may get there before the end of October!. Key danger areas for this scenario are a. for the trend line to contain corrections, and b. that 8080, MUST HOLD.
The Crumbliest Flakiest Stocks Bull Market Never Tasted Before - 7th Sept 09
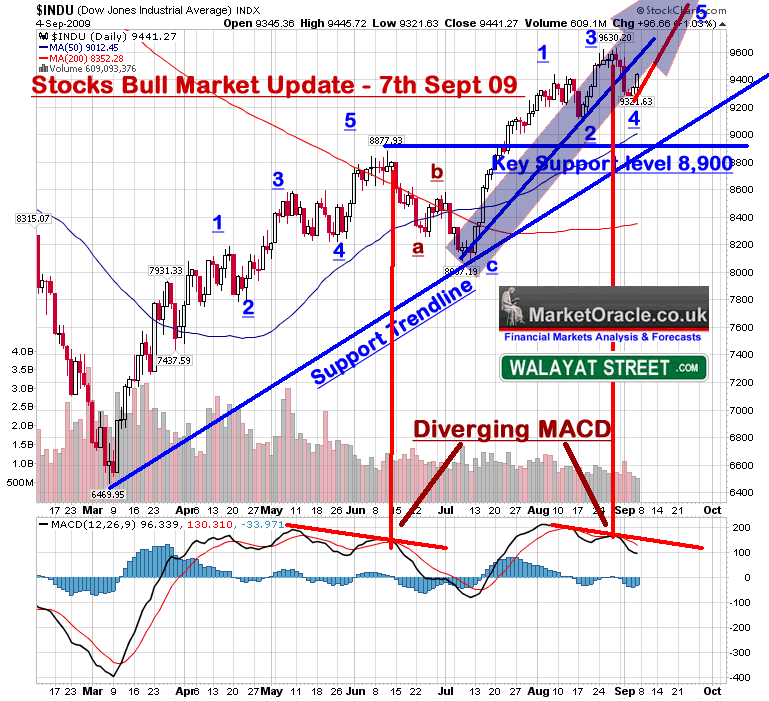
The target for the termination of the current phase of the bull market rally was between 9750 and 10,000. As mentioned above, I am not expecting an easy ride for the fifth wave as clearly it is an obvious pattern to interpret following waves 1,2,3,4. What does this mean ? Well wave 3 is screaming weakness, so that suggests a weak push higher rather than something that resembles wave 1.
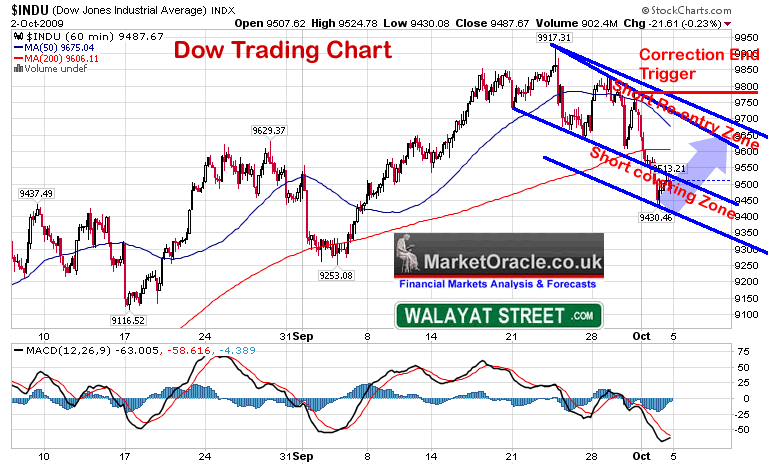
Stocks Bull Market Correction Continues, U.S. Dollar Bears Running Out of Time? - 4th Oct 09
Stocks Bull Market Forecast Update Into Year End - 2nd Nov 09
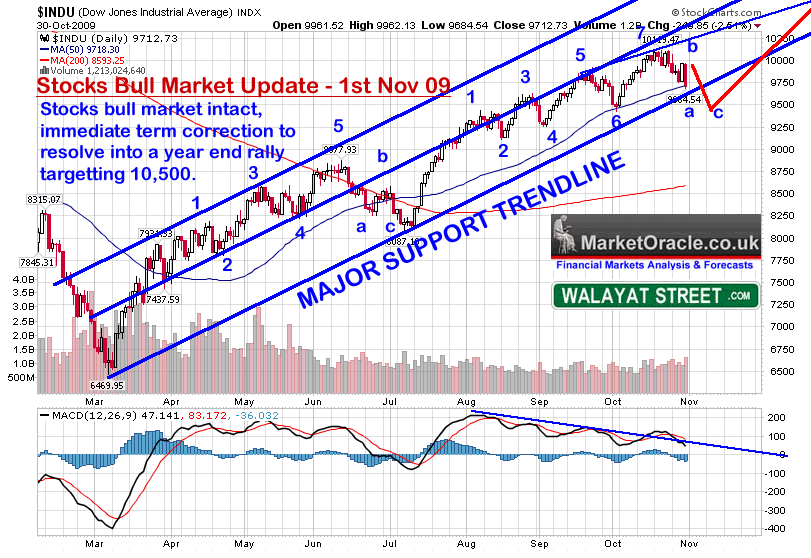
There is nothing to suggest at this point in time that the stocks bull market is over which means that that corrections are for accumulating into, the overall trend is for stocks is to continue climbing a wall of worry whilst investors are scared by the vocal crash is coming crowd that will continue to re-write history to always be right in hindsight to again come out with more crash calls over the next few months as the Dow chart of the 1930's gets it's start / end date manipulated again so as to fit fresh crash calls.
The stocks bull market that has raged since the March low has fulfilled the original objective for a 50% advance, therefore upside for the next two months looks limited with greater risk of downside in the coming weeks though pending a break of the major support trendline which implies a rally in the immediate future. All in all this is suggestive of a downtrend towards 9,400 into Mid November with a year end rally to back above 10,000 targeting a rally high in the region of 10,350 to 10,500 during December.
Stock Market Santa Rally and Election Weapons of Mass Deception - 13th Dec 09
My concluding thought, we get the santa rally to a new 2009 high for the Dow into the last few days of December and then the market starts the significant correction.
Economy, Inflation and Interest Rate Forecasts Conclusions Applied to the Stock Market
The in depth economic analysis of the past 2-3 months (inflation, economy, interest rates) has resolved towards the conclusion for a strong above trend economic recovery and rising inflation (UK early spike higher) during 2010 with a relatively mild up tick in interest rates during the second half of the year which will allow governments the opportunity to get a grip with the deficits under the momentum of economic growth and the return of consumer / investor confidence. However, I also do expect both the Bank of England and U.S. Fed to continue quantitative easing aka money printing to monetize the huge budget deficits, without which market interest rates would be significantly higher.
The analysis conclusions are highly supportive for the stock market during 2010 and probably beyond as corporate earnings continue to play catch up to the stock market price trends with institutions and large speculative funds continuing to dump cheap money into the stock market and other speculative assets having been driven out of low yield assets, therefore driving prices higher whilst the small investors are left to follow the perma bear crowd that are perpetually expecting a break of the March 2010 lows as though it is a done deal.
Stock Market Mega-Inflationary Trend
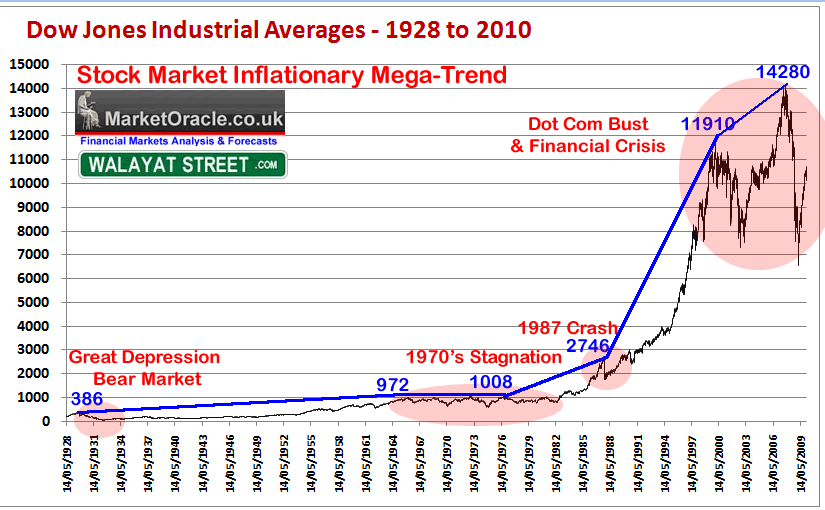
The Above graph illustrates the stock market inflationary mega-trend or growth spiral which basically implies that the further a general stock market index such as the Dow, S&P or FTSE deviates from its peak in terms of price and time, then the greater the long-term potential it presents for investors. Which highlights why the early 2009 stock market plunge into the March lows was literally a once in a life time buying opportunity, as I warned investors to prepare towards in October 2008 - Stocks Bear Market Long-term Investing Strategy
Whilst I don't like to transpose past price action onto the present as it is not reliable, however I do recall at the time of the rally off of the 1991 decline everyone had their eyeballs fixated on the 1987 crash lows as though they would be revisited, when in fact it was another great buying opportunity of a lifetime as the subsequent price action illustrated. All you folks may not realise this now but the period from 1991 to 1996 was ALL followed by perpetual extremely bearish commentary of the end is nigh. Few BOUGHT This rally ! Even Greenspan appeared to play the bearish card at about Dow 6,000 with his famous Irrational exuberance speech at the end of 2006 to frighten and keep weak small investors out of the market that would only return towards the end of the dot com boom. The Dow doubled from 1996 to 2000.
Where do we stand today ? Well we have not even reached the stage that demands another Irrational Exuberance speech. We are in the overwhelming bearish commentary phase that frightens and keeps all but the smartest money out of the market much as the occurred following the 1987 crash rally, much as occurred from 1991 to 2006. Presently this commentary appears as an avalanche of bearishness on EVERY correction, the consequences of which is reflected in the volume data that shows most people are NOT buying the rally but SELLING, which is why I termed this a stealth stocks bull market back in March 2009.
What we are witnessing today is pretty much similar behaviour that I suspect will persist for many years! whilst the bull market rages on!
Yes, for 2010 the best of the gains in terms of price / time are behind us, however the Dow is a long way from reaching an overbought / expensive state, therefore still presents a good long-term accumulating level.
Market Manipulation
I came to the conclusion a couple some time a couple of decades ago that the markets were manipulated, therefore taking account of market manipulation in terms of what direction will the dark pools of capital deployed by the worlds investment banks and speculative funds take the markets next as part of its psychological make up i.e. Mr Market, is a very important component of the tripartite of analysis in addition to technical & inter-market analysis and the sum of all fundamental analysis. Put all three together and one has a higher probability of profiting from today's investment decisions. Apart from working within a dark pool institution such as Goldman Sachs, the only way to get an insight into their behaviour is to evaluate which trend would the dark pools most profit from at any particular point in time i.e. market psychology which usually means the opposite action to the consensus view.
This is one one of the key contributory reasons why I called the birth of the stocks stealth bull market of March 2009 that has since consistently been called a bear market rally despite the fact it has seen a phenomenal 65% gain in 10 months. I mean that is a DREAM return for investors, one cannot hope for or expect anything better, but instead of enjoying a hugely profitable bull run, most small investors have been convinced to WAIT for evidence of economic and corporate earnings recovery by which time as occurs it will be TOO LATE as the market will have already moved, precisely as I warned of in Mid March 2009.
So what does my interpretation of the dark pools or market psychology telling me today ?
It is telling me for the stock market as a whole that the dark pools are still engaged in accumulating into a stock market multi-year mega-trend which at present is in the motion of shaking out the temporary weak longs along. Which means we are STILL in a stealth bull market where the vocal media-sphere view it as a BEAR MARKET RALLY that has ENDED, consistently WRONG market calls by popular perma-bears are a god send for the market manipulating dark pools of capital as they continue to accumulate and profit from the stealth mega-trend.
Stock Market Crash Again?
Forget swine flu, the pandemic that has been doing the rounds for the past 6months is that of another Crash with the 1930's chart dusted down and presented as near fact of what is to transpire on every correction. However the markets response has so far always been to eventually push to a new high for the move.
What happens to the crash calls ? They get amended and rolled out again on the NEXT correction! Don't believe me go check out what I wrote on 2nd November.
However the damage has been done as short stops are hit and losses accrued that no broker will refund for the next crash call.
Stock Market Crash Calls
1. You CANNOT know with any reliability that the stock market is going to crash until AFTER it has actually peaked and entered a downtrend. Anyone that tells you a bull market pushing to new highs is going to crash is going to lose you all your money, as the market rallying significantly from the crash call NEGATES THAT CALL where trading is concerned, because any short positions enacted upon the call are stopped out!
2. You can only enter a Crash TRADE barely a day or hours before the crash event. Crash calls made weeks, months or years in advance are WORTHLESS where trading is concerned, and where investing is concerned, all investors should have stops on their positions based on technical considerations of where they would admit their analysis is wrong on a particular stock.
Crash calls are dangerous in that bring emotions into play which instead of staying focused on reacting to price action, adrenaline gets traders to commit to positions that will soon most probably bust their accounts where EVEN if the market eventually does CRASH, they will have been wiped out by the intervening rally SINCE the crash call! It is this fact that that is always forgotten.
Don't believe me ? Go check ALL of the hyped stock and other market crash calls that in actual fact WERE FOLLOWED by moves that would have wiped out REAL trades had those calls been acted up on.
During 2009 I have shared some of my trading ideas that may go towards a future ebook-
- Get in Synch with the Market
- Forecasting and Trading
- The Holy Grail of Trading
- How to Learn to Trade
- Don't Think Too Much
Economic Depression, What Depression ? - US GDP soared in the fourth quarter at an annualised 5.7%, yes, the rate of accent is probably NOT sustainable, but the debt fuelled bounce will continue a while before it peter's out into. The key point is as I pointed out in the analysis of October 2008. That we are NOT heading for another 1930's GREAT DEPRESSION, and therefore readers should scrub the notion of following the 1930's chart pattern towards anything like a 90% stocks crash. So far the analysis is proving correct.
Corporate Earnings - Corporate earnings have FOLLOWED the stock market higher, despite continuous doom orientated commentary of the past 10 months that has repeatedly stated that corporate earnings forecasts implied stocks could NOT rally.
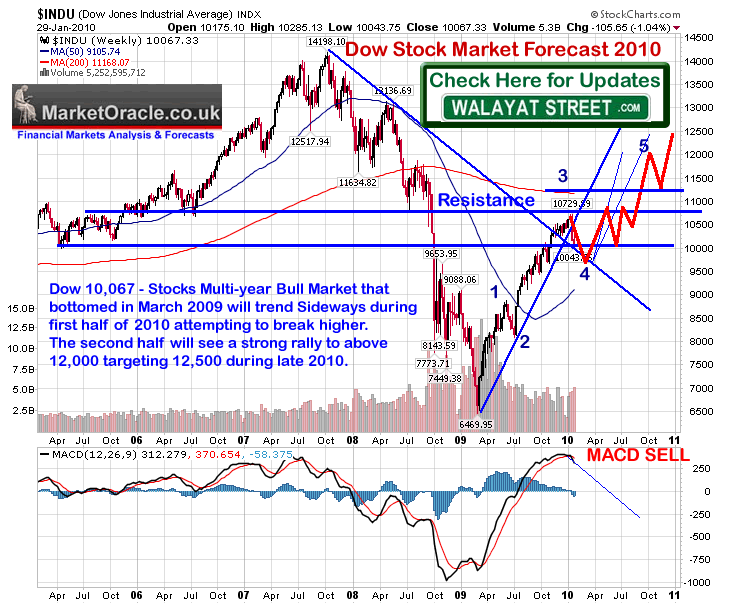
ELLIOTT WAVE THEORY - The elliott wave pattern resolves to an easily recognisable wave 4 correction which implies a further 5th impulse wave higher will follow that could take the Dow significantly higher. Clearly the alternative more bearish count is that Wave 3 was a Wave C of an ABC move which would imply that the rally to date corrected the preceding bear market from the 2007 high. My interpretation is that we get something in the middle, i.e. that BOTH interpretations are now FAR TOO EASILY discernable from the price charts which suggests to me we get a volatile 5th wave higher, rather than a strong wave similar to Wave 1 and Wave 3. On a shorter term basis the immediate trend should resemble an ABC correction of which we are presently in the wave A decline that should shortly resolve towards a B wave rally before a C wave decline to end the correction.
TREND ANALYSIS - The Dow is falling towards major support at 10k. Given the strength of the downtrend to date, the probability favours a break of 10k that would target approx 9,600. The bull market trendline has been breached which suggests that the stock market has entered a new character of behaviour that will be significantly different to that which followed the March 2009 low. I.e. greater volatility, which suggests it will take the market some time to break the 10,729 high, which will probably now not occur until the second half of 2010.
SUPPORT / RESISTANCE - There is a series of strong support in the region of 10,000 to 9,800. and then 9,500. Should 9,500 break then the Dow could tumble all the way to 50% of the rally at 8,600. Overhead resistance lies at 10,300, then 10,400. With strong resistance in the region of the 10,600 to the high of 10,726. It will probably take some time for this resistance to be overcome. Next resistance above is at 11,250 that may mark a pause in the uptrend if it breaks higher enroute towards the target for 2010.
PRICE TARGETS - Downside price targets resolve into the 9,500 to 9,800 zone, therefore this should contain the current correction, a failure here would negate this analysis and probably mark the end of the bull market which initially targets a decline to 8,600. Upside projections show difficulty in breaking above the 10,729 high, though once overcome the Dow would target a level north of 12k.
MACD - The MACD confirms both the significant correction currently underway and the expectation of difficulty for the Dow to overcome its recent high for some time i.e. until it has been able to work out the overbought state. This suggests that it may take the Dow several attempts to break above 10,729 during 2010, with the eventual break out higher probably not taking place until the third quarter of 2010.
VOLUME - Volume has been WEAK throughout the rally, which has been one of the main reasons why so much commentary has been bearish during the rally. However it is perfectly inline with that of a stealth bull market and also implies that this rally has NOT been bought into. So all of the talk of hyper bullishness investor sentiment is basically rubbish as there is no sign of such sentiment in the volume, which remains heavier on the declines than the rallies and thus suggestive of SELLING rather than buying into the rally.
SEASONAL TREND - There is a strong seasonal tendency for stocks to rally into Summer then correct in October followed by a sharp rally into December. This is contrary to my growing expectations of a tough first half of 2010. In fact we may see in large part the opposite trend during 2010.
PRESIDENT CYCLE YEAR 2- The impact of the 2nd year of the presidential cycle on the stock market is for a weak trend into September, and a rally in the fourth quarter into the end of the year for a small average gain for the year. This much more closely resembles my growing expectations for 2010 then the seasonal trend.
Stock Market Conclusion
Whilst the bull market is undergoing a significant correction that targets 9,500 to 9,800, nothing in this analysis has changed my long-term conclusion as of March 2009 that we are in a strong multi-year stocks bull market. Therefore I will leave it to others to still debate on whether or not to invest or playing around with transposing of charts form the 1930's whilst one of the greatest bull markets in history continues to pass them by as the further the stock market deviates from its bull market peak the greater will be the buying opportunity presented.
Where the forecast is concerned, Ironically I am finding the first half of 2010 much more difficult to conclude towards than the second half, as I do expect a strong rally in the second half of 2010 to a new high for the bull market with the Dow breaking above 12,000 during late 2010 and may hold onto the 12k level into year end. The first half of 2010 will probably resemble a wide sideways trend with an upward bias after the current low is in, the Dow will repeatedly attempt to break above 10,729, how many times ? well there lies the volatility question, however turning towards utilisation of elliott wave theory, I am going to conclude the analysis towards 2 failed attempts before the final break higher, but it could be 1 or 3.
Dow (DJIA) 2010 Stock Market Trend Forecast Conclusion
Dow 10,067 - Stocks Multi-year Bull Market that bottomed in March 2009 will trend Sideways during first half of 2010 attempting to break higher. The second half will see a strong rally to above 12,000 targeting 12,500 during late 2010.
Ensure you subscribe to my free newsletter and visit walayatstreet.com for regular updates and reappraisals of the trend in light of subsequent price action during 2010 and beyond.
Risks to the Forecast
Technically we have had a major sell signal on break of the main uptrend line which means the current correction has YET to bottom, my target is eventually a bottom at 9,500 to 9,800 after a corrective B wave rally towards 10,300, the C wave decline should hold at this, however if 9,500 goes then this at least implies a bear market that initially targets 8,600.
The primary risk for the end to the bull market is that the central banks pull the plug on easy money as a consequence of a series of sovereign debt crisis. I.e. forced to push interest rates much higher than forecast to prevent a bond market / monetary collapse. In reality the governments have a window of opportunity to benefit form the strong economic recovery currently underway to CUT the budget deficits and get a grip on debt to GDP ratios. If they waste this opportunity then this forecast could fail as it resolves towards a bear market trend back towards the March 2009 lows.
However I put this risk at this point in time at about 25%, small but significant. It really depends on the economic bounce being as strong as I forecast it to be which will carry the markets AHEAD of it, and inflation and consumer confidence along with it therefore allowing deficits to be cut along side economic growth.
FTSE 100 Forecast 2010
I expect the FTSE to follow a similar trend to the Dow in terms of price pattern which resolves towards a target for FTSE 6,250 to 6,600 by late 2010, with similar downside risks.
Again ensure you are subscribed to my FREE newsletter to receive both future updates as well as the inflation mega-trends ebook which includes many economic and market trend forecasts for 2010 and beyond, to be emailed out within a week.
Source and Add Comments Here: http://www.marketoracle.co.uk/Article16948.html
By Nadeem Walayat
http://www.marketoracle.co.uk
Copyright © 2005-10 Marketoracle.co.uk (Market Oracle Ltd). All rights reserved.
Nadeem Walayat has over 20 years experience of trading derivatives, portfolio management and analysing the financial markets, including one of few who both anticipated and Beat the 1987 Crash. Nadeem's forward looking analysis specialises on UK inflation, economy, interest rates and the housing market . Nadeem is the Editor of The Market Oracle, a FREE Daily Financial Markets Analysis & Forecasting online publication. We present in-depth analysis from over 500 experienced analysts on a range of views of the probable direction of the financial markets. Thus enabling our readers to arrive at an informed opinion on future market direction. http://www.marketoracle.co.uk
Disclaimer: The above is a matter of opinion provided for general information purposes only and is not intended as investment advice. Information and analysis above are derived from sources and utilising methods believed to be reliable, but we cannot accept responsibility for any trading losses you may incur as a result of this analysis. Individuals should consult with their personal financial advisors before engaging in any trading activities.
Nadeem Walayat Archive |
© 2005-2022 http://www.MarketOracle.co.uk - The Market Oracle is a FREE Daily Financial Markets Analysis & Forecasting online publication.


