Stock Market Trend Tracking the 45 Day Cycle
Stock-Markets / Cycles Analysis Jan 26, 2010 - 01:41 AM GMTBy: Jim_Curry
 Through my outlooks in recent years, I have often pointed out that the most dominant cycle in US stocks is the nominal 10-week component - which, at the present time, has a current 'expression' of 45 trading days from trough-to-trough.
Recently, this component has begun to contract even further, with the average now being closer to 38-40 trading days. That is not that telling, though I should point out that cycle lengths will tend to contract in more bullish trends - and expand in more bearish ones. Obviously, the contraction in this cycle is due somewhat as the result of the larger uptrend seen coming off the March, 2009 bottom.
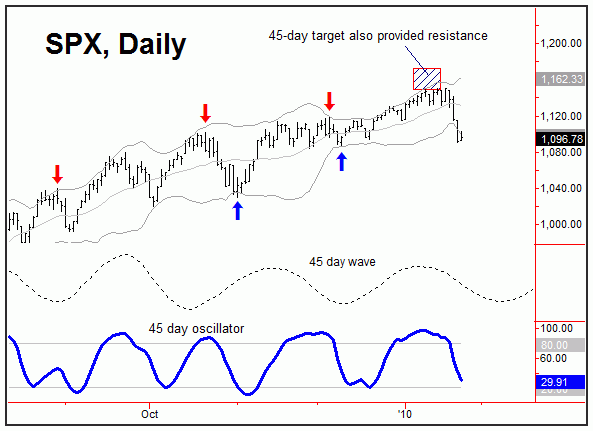
While there are differing opinions as to whether a major top was made last week in the SPX, what I want to do here is to take a closer look inside this 45-day wave, to see what statistical inferences (if any) could be drawn; this may give us some idea of how the action could play out going forward. The chart below shows the approximate position of this 45-day cycle:

Going back to the second week of November, 2009, this 45-day component had turned to the upside, then confirming an original target to the 1130 - 1153 region on the SPX; this was finally met in December. However, as this target was being approached, the same cycle confirmed an additional upside projection to the 1148 - 1172 range; this was also regarded as firm resistance level for the index, and was favored to contain the upward phase of the same.
Last Wednesday's reversal back below the 1130.16 figure was the downside 'reversal point' point for this 45-day wave. In other words, taking it out was a better-than-average indication that it's downward phase was back in force, which takes us to where we are at the present time.
In taking a look at a statistical/pattern analysis of this cyclical component, it had to have registered the pattern of a 'higher-high' at the 1/19/10 peak of 1150.45 SPX CASH. And, when seen in the past, the average time decline was around 10 trading days from peak to trough; currently, we are only 4 days along from that high.
Going a bit further, the current 45-day downward phase looks like it is going to take out the 1085.89 figure on the SPX - which was the last confirmed bottom for the this component. In other words, if seen. then it would indicate that the pattern we are witnessing would be that that of a 'higher-high/lower-low'. And, when this particular pattern has occurred in the past, the action was more bearish - with the average time decline being in the range of 24 days off the highs - while about 85% of these had seen declines of 14 days or more before bottoming.
Taking the above information, we can infer that the probabilities tend to favor a longer-than-normal 45-day down phase - and more especially if the 1085 level is taken out on the SPX. In terms of time, a decline of 10 days off the top would favor the low for this cycle not to be made prior to 2/2/10. However, using the more bearish pattern/statistics, should the SPX take out the 1085 figure then a decline of 14 days would put the odds in favor of a low being held off until 2/8/09 or later. Lastly, should the average of 24 days be seen, then the next 45-day low could potentially stretch out until 2/22/09 or later, though this seems a less-plausible scenario here - but not one that can be ruled out.
In looking at a statistical analysis of price with this 45-day component, should the SPX see the pattern of a 'higher-high/lower-low' (by taking out the 1085 level), then the average decline phase in the past has been in the range of 8.4% off the peak. If seen on the current rotation, this would favor a move to the 1053 level or lower before the 45-day cycle attempts to bottom in the days/weeks ahead.

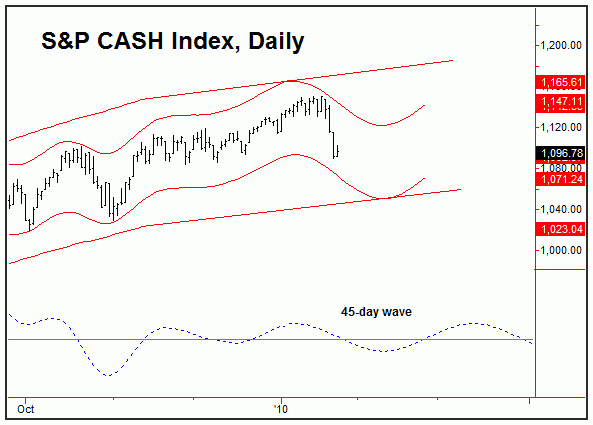
Lastly, in getting a quick view of the cycle channels we can gain additional information, along with some added visibility. On the chart above you can see that the (smaller) 45-day cycle channel meets with the larger wave (which is deemed to be pointing slightly higher at the present time) at or near the same 1050 level () for the SPX. The 45-day channel also offers a bit more input, in that the top of the same currently comes in at or near the 1120's on the SPX (10 points) - and thus is now going to act as firm resistance to any short-term rally attempts.
I should be quick to add that the statistical assumptions won't always be met; nothing is ever 100%. However, we have found over the years that they do tend to play out a good-majority of the time, certainly better than random. Even said, there is always the potential that the cycle could confirm an earlier turn than is suggested - which is why it always pays to monitor the accompanying technical action. We'll reassess the again at some point in the near-future - including taking a look at potential alternate scenarios for the larger channel pathway.
By Jim Curry
Market Turns Advisory
email: jcurry@cycle-wave.com
website: http://cyclewave.homestead.com
Jim Curry is the editor and publisher of Market Turns advisory, which specializes in using cyclical analysis to time the markets. To be added to our mailing list click HERE
Disclaimer - The financial markets are risky. Investing is risky. Past performance does not guarantee future performance. The foregoing has been prepared solely
for informational purposes and is not a solicitation, or an offer to buy or sell any security. Opinions are based on historical research and data believed reliable,
but there is no guarantee that future results will be profitable. The methods used to form opinions are highly probable and as you follow them for some time you
can gain confidence in them. The market can and will do the unexpected, use the sell stops provided to assist in risk avoidance. Not responsible for errors or
omissions. Copyright 1998-2007, Jim Curry
JIm Curry Archive
|
© 2005-2022 http://www.MarketOracle.co.uk - The Market Oracle is a FREE Daily Financial Markets Analysis & Forecasting online publication.


