


UK Public Spending Deficit Debt that Risks Bankrupting Britain
Economics / UK Debt Jan 21, 2010 - 12:43 AM GMTBy: Nadeem_Walayat

 The government is set to spend an estimated £680 billion this financial year on the public sector (2009-10), that is currently running an ANNUAL £180 billion deficit, i.e. the government spends £180 billion a YEAR more than it earns which is contributing to towards igniting Britains inflationary debt spiral, that risks accelerating trend towards an hyper inflationary bust leaving savers with worthless paper and the economy in ruins.
Where Does All The Money Go?
The following graph illustrates a breakdown of the public sector spending budget for the current financial year 2009-10 total of £680 billion (excluding the bailout of the banks).
The budget deficit is running at £180 billion a year or at 27% of the total budget i.e. the the governments total revenues are £500 billion against expenditure of £680 billion, hence a deficit of £180 billion added to the national debt known as the Public Sector Net Debt (PSND) currently standing at about £809 billion, though excluding the hidden tax payer liabilities that extend to several more trillions of pounds. Nevertheless £809 billion of debt would cost about £33 billion in interest per year to service this debt, as the debt grows so does the cost of servicing the debt, more so as the supply of government bonds increases then so will the market demand ever higher interest rates to buy this flood of debt which illustrates why running anywhere near an £180 billion annual budget deficit is NOT sustainable, as it would ignite the earlier mentioned inflationary debt spiral as interest payments soar which therefore requires urgent action to CUT the deficit to BELOW 6% of GDP / £75 billion, with £105 billion necessary to be cut comprising of tax increases, economic growth and spending cuts of £60 billion.
However, both major political parties have announced that they are not only not going to cut spending on the largest spending departments of Education or the NHS but GROW these budgets over the coming years. Similarly both parties have pledged to grow pensions and neither can I see how welfare can be significantly cut as unemployed will remain unemployed until they get a job. Furthermore debt interest at £33 billion per year is expected to continue to grow inline with each month the government racks up another large deficit (upto £20 billion per month), which therefore suggests that of the total £680 billion spending budget, the amount both parties are only making available to be cut from is £215 billion.
So a proposed 10% cut of the available budget heads of £215 billion, which even if achievable would only result in a cut of £21.5 billion, which would not make the necessary dent in the annual deficit in order to prevent the inflationary debt spiral from taking off and all of the consequences of loss of confidence in sterling.
Public Spending Has to Be Cut by £60 billion
The Labour government announced in the November 08 Queens speech with much fanfare a LAW to halve the public sector net deficit over the next 4 years by means of tax rises and spending cuts. The objective of the Law is to halve the deficit and NOT to pay down the total accumulating debt. What this amounts to is that the annual budget deficit of approx £180 billion for 2009/10 being halved to an annual deficit of approx £90 billion by 2013/14 which suggests Britians National debt is expected to increase by a further £500 billion to an approximate total of £1,300 trillion or 100% of GDP by 2013/14.
The below graph illustrates the updated Government projection for the annual Public Sector Net annual deficit against Alistair Darlings November 08 and April 09 targets, as well as my original estimate of November 2008 (Bankrupt Britain Trending Towards Hyper-Inflation? ) that remain unchanged.
The target PSND of £1,300 trillion would approximately equate to 100% of GDP by 2013/14. This is against my original target as of November 2008 of £1.48 trillion by the end of 2003/14 at a projected 114% of GDP. The graph also shows total tax payer liabilities that illustrate a more truer picture of Britains debt crisis i.e. debt as a consequence of bailing out the bankrupt banks and public sector hidden liabilities such as public pensions, and yes we are towards the extreme end of the scale in terms of global economies.
However the problem for Britain is that whilst the British economy stagnates, many of the other world economies will not stagnate but grow thus forcing up the price of commodities, goods and services and hence result in higher inflationary pressures. Which therefore implies that the budget deficit will widen further as public spending will need to be higher in an attempt to counter loss of purchasing power of the currency. A higher budget deficit would require higher interest rates and therefore more monetization of government debt which confirms the vicious inflationary debt spiral cycle. The only true answer to escape the inflationary cycle is to get a firm grip on the budget deficit in the immediate future, the longer action is delayed then the more difficult it will be to deal with.
Setting a target of halving the budget deficit over the next 4 years is not going save the economy from stagflation as by the end of this period Britain will still owe far more than it does today so actually be in a far worse budgetary and probable economic state in real-terms.
What Does This mean ?
It means that both Gordon Brown and David Cameron when they say they are going to ring fence and grow the NHS and Education, are LIEING, because it is impossible to even contemplate anywhere near a £60 billion cut in public spending without INCLUDING these departments.
Public Spending
The public sector has have gotten fat on out of control Labour Government spending, nothing illustrates this more than NHS spending which has grown from 6% of GDP in 1997 to 10% of GDP now, therefore Britain is paying 66% more in NHS spending as a proportion of the economy will little improvement in service delivery due to a near continuous fall in productivity.
The Labour government despite tripling the NHS budget / GP Pay over the past 10 years to £120 billion ($198 billion) has resulted in a continuous fall in productivity over the past 6 years or so, and is only now in the final few months of its government for electioneering making announcements to implement reforms necessary to drag the NHS into the 21st century with a view to putting the patient first for the first time since its creation.
The NHS in its present form is a funding black hole with falling productivity that is sucking in ever increasing amounts of cash in real terms. Real reforms are urgently required otherwise Britain will be heading for a health service crisis as the GDP share of health spending continues to expand from 3.5% in 1948 to 10% today to above 13% by 2020, all without any real improvement in patient healthcare.
NHS GP Pay Illustrates Out of Control Spending
British MP's were humiliated during May and June across all parties as public outrage and indignation oat the abuse of the MP expenses system with MP's responding with how MP pay has failed to keep pace with that of NHS GP's which is one of the key reasons as to why they had resorted to what amounts to legalised theft from the electorate.
MP - NHS GP Pay Comparison
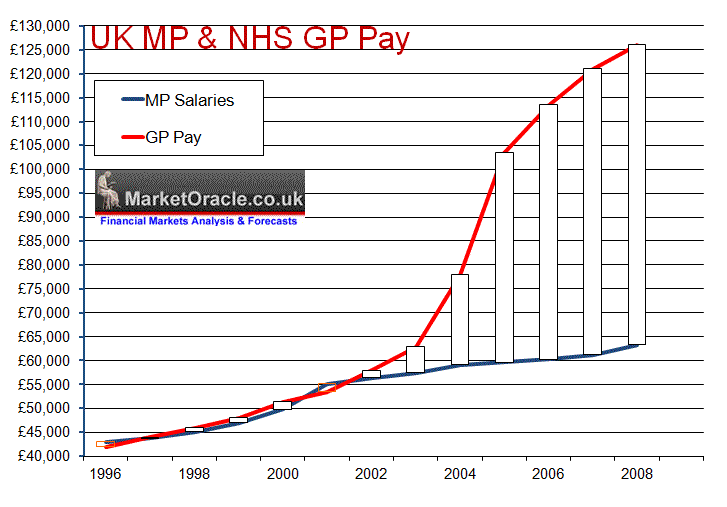
When Labour came to power in 1997 average MP pay was £43,722 against average NHS GP pay of £44,000, so both were inline with one another at that time. However as the above graph clearly illustrates in 2003 something started to go seriously wrong with GP Pay which took off into the stratosphere as GP's decided to award themselves pay hikes of more than 30% per annum at tax payers expense that has lifted average GP pay to £126,000 per annum against £64,000 for MP's.
How could this happen, unfortunately this was as a consequence of the now infamous GP contracts where to be blunt greedy GP's hoodwinked gullible incompetent Labour government health ministers into signing upto contracts which were meant to deliver greater value for money for the tax payer but were designed to do the opposite and resulted in GP's pay doubling whilst at the same time cutting back on hours worked. This was not only a total fiasco for the nations health and finances but also ignited jealousy amongst MP's that directly led to the adoption of the policy of claiming expenses to the maximum so as to fill the ever widening gap between MP's and NHS GP's, as MP's could NOT get away with awarding themselves pay hikes of 30% per annum without losing their seats at the next general election in response to voter outcry, therefore across the board systematic abuse of expenses started to take place which basically means real average MP pay is currently approx £98,000 per annum.
Therefore even with the mega spending departments of Health and Education included, a 10% cut would still only total cuts of £42 billion still short of the £60 billion target which illustrates the crisis Britain is facing as a consequence of out of control Labour Government spending over the past 10 years that just as badly risks bankrupting Britain as anything the bankster's did.
Tax rises
Tax rises have already been scheduled by Labour party to start kicking in during 2010, with the first on 1st of Jan 2010 when VAT goes back up from 15% to 17.5% with NI scheduled to follow in April. Add to this the projected post election tax hikes of an increase in the basic rate of income tax to 24p and higher upper band increased from 40p to 45p.Though a further VAT hike to 20% may be overkill and could trigger the feared double dip recession that would be a disaster, so I doubt if 20% VAT will follow, but it is a tough call as it could raise a further £12 billion per year. In conclusion total tax revenues could increase by a sizeable £30 billion a year and contribute to a significant dent in the deficit.
Economic Growth
My forecast for the UK economy is for growth of 2.8% growth for 2010, therefore this should like for like imply an approx 2% of GDP cut in the annual deficit or £26 billion by means of increased revenues due to economic growth.
Conclusion
Therefore the overall conclusion is for the annual deficit to be cut by £98 billion from £180 billion to £82 billion for 2011, which would still approximate a budget deficit at 6% of GDP but allow breathing space for the country to continue to both inflate and grow its way out of debt. But this does imply that at the very least the next 5 years are going to be extremely hard on the people of Britain in terms of high taxation, high inflation, high real unemployment (not the doctored unemployment statistics) and reduction in public services, which sows the seeds of serious civil unrest starting in 2011 on a scale not seen since the 1980's.
The immediate risk of delaying action will be that the market will FORCE the Bank of England to RAISE interest rates, otherwise GILT auctions will fail, which will undoubtedly trigger more Q.E. regardless of commentary in the mainstream press that Q.E. is about to come an end which my article (08 Jan 2010 - Bank of England UK Quantitative Easing Money Printing to Hit £275 Billion 2010 ) illustrated is not possible.
At the end of the day, if the government does NOT get a grip of the growing debt mountain then this WILL PREVENT FUTURE ECONOMIC GROWTH i.e. the economy will stagnate, and stagnate and stagnate UNTIL the debt crisis is dealt with, which means that the total debt burden needs to be reduced in terms of % of GDP, the current level of debt that is set to break above 100% of GDP on the PSND measure IS NOT SUSTAINABLE, In fact it WILL trigger the DEBT crisis that will send sterling through the FLOOR and Interest rates through the ROOF.
THIS CRISIS IS REAL and IMMINENT and REALLY DOES REQUIRE URGENT ACTION TO PREVENT FINANCIAL WIPEOUT Much as the Icelanders saw everything they had worked for, for decades go up in smoke virtually overnight.
- Hedge Against Inflation
- Hedge Against Stagflation
- Hedge Against an incompetent Government and Bank of England that only know how to keep printing money.
For what to do to prevent financial wipeout ensure your subscribed to my always FREE newsletter, which will also be the transmission route for my FREE INFLATION MEGA-TREND Ebook to be completed within a week or so.
UK Inflation Forecast 2010
My inflation forecast for 2010 as of 27th December 2009 forecast UK inflation to rise to above 3% early 2010, spiking as high as 3.6% and stay above 3% for most of the year only dipping to 2.7% by the end of the year as illustrated by the below graph.
UK Interest Rates Forecast 2010
My in-depth analysis and forecast of 13th Jan 2009 forecast that UK interest rates would rise to 3% by mid 2011, and end 2010 at the target rate of 2%. However looking further out, if the government continues to run an annual budget deficit anywhere near 8% of GDP in 2 years time i.e. early 2012, then by then we could be looking at UK interest rates at ABOVE 5% by then.
UK Economy GDP Forecast 2010
My in depth analysis and forecast as of 31st December 09 forecasts strong UK economic growth of 2.8% for 2010 and 2.3% for 2011 which follows the forecast for 2009 for GDP contraction of -4.75% as of Feb 2009.
Source : http://www.marketoracle.co.uk/Article16636.html
By Nadeem Walayat
http://www.marketoracle.co.uk
Copyright © 2005-10 Marketoracle.co.uk (Market Oracle Ltd). All rights reserved.
Nadeem Walayat has over 20 years experience of trading derivatives, portfolio management and analysing the financial markets, including one of few who both anticipated and Beat the 1987 Crash. Nadeem's forward looking analysis specialises on UK inflation, economy, interest rates and the housing market . Nadeem is the Editor of The Market Oracle, a FREE Daily Financial Markets Analysis & Forecasting online publication. We present in-depth analysis from over 500 experienced analysts on a range of views of the probable direction of the financial markets. Thus enabling our readers to arrive at an informed opinion on future market direction. http://www.marketoracle.co.uk
Disclaimer: The above is a matter of opinion provided for general information purposes only and is not intended as investment advice. Information and analysis above are derived from sources and utilising methods believed to be reliable, but we cannot accept responsibility for any trading losses you may incur as a result of this analysis. Individuals should consult with their personal financial advisors before engaging in any trading activities.
Nadeem Walayat Archive |
© 2005-2022 http://www.MarketOracle.co.uk - The Market Oracle is a FREE Daily Financial Markets Analysis & Forecasting online publication.