U.S. Dollar Index Expected to Rise During 2010
Currencies / US Dollar Jan 20, 2010 - 03:39 AM GMTBy: Guy_Lerner
 In 2009, investors were down on the US Dollar, and anytime the US Dollar was down, everything else was up. But as we head into 2010, the US Dollar appears to have found support above the all time lows made around $70 in March, 2008 and reversed higher. There is reason to believe that from a technical perspective this reversal is for real, and it is real enough that it should have implications for other markets.
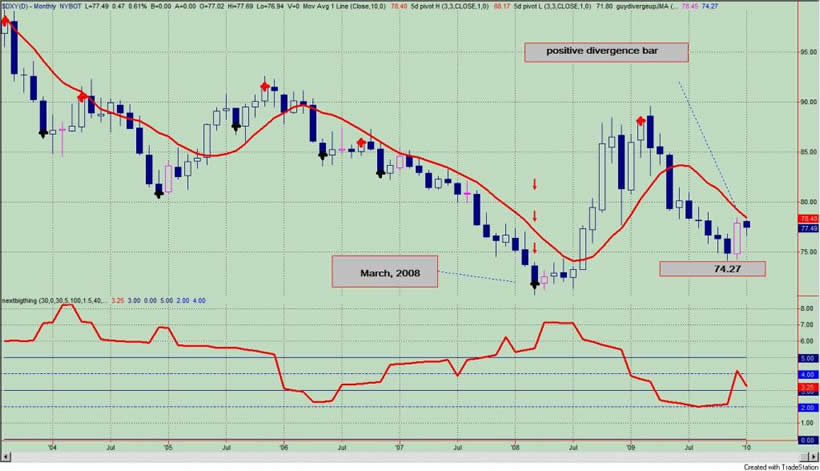
Figure 1 is a monthly chart of the Dollar Index (symbol: $DXY). The "next big thing" indicator is in the lower panel. We note that in March, 2008 the Dollar Index found a bottom (red down arrows on chart) while the indicator was in that zone that suggested a secular trend change was likely. The subsequent up move was more like a bounce (within an ongoing down trend) than a secular upward price move, but more importantly, the lows from the 2009 down draft have held above the prior pivot point low seen in March, 2008. December's 2009 strong move in the Dollar Index, resulted in a positive divergence bar; these are the price bars labeled with the pink markers.
This positive divergence bar is significant for three reasons: 1) we know that positive divergence bars represent slowing downside momentum; 2) we also know that they tend to lead to a trading range with the highs and lows of that positive divergence price bar being the extremes of that range; and 3) positive divergence bars are often seen at market bottoms prior to secular trend changes.
Figure 1. $DXY/ monthly

The important point is this: the low of the positive divergence is support, and this is at 74.27 on the $DXY. This becomes our line in the sand, and a monthly close below this level is not a good sign for the green back.
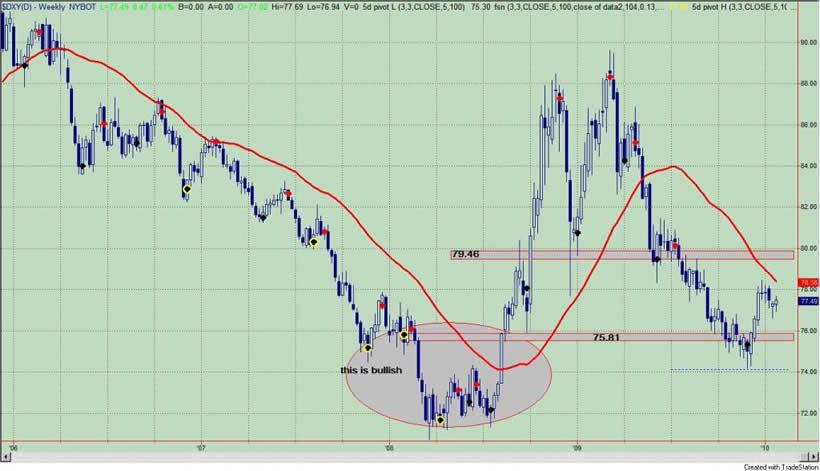
Figure 2 is a weekly chart of the $DXY. This chart shows our normal pivot low points (black dots) and the special key pivot points which are those pivots that occur when sentiment towards the Dollar Index is bearish; these are the yellow and black dot pivots. In general across multiple assets, a close above 3 normal pivot points is bullish; this has not happened yet for the Dollar Index but a weekly close above 79.46 would meet this criteria. In general across multiple assets, a close above 3 key pivot points is bullish; this has happened. And viewed by this lens, 2009's down slide was just a pullback in a bull market for the Dollar Index that began in 2008.
Figure 2. $DXY/ weekly

So within this context, I am bullish on the Dollar Index.
The questions to be asked are the following: 1) why is the US Dollar going higher?; and 2) if the US Dollar is going higher, how can we use that information?
Why is the US Dollar going higher? Despite all its drawbacks, the Dollar remains the world's reserve currency and safe haven. Low short term interest rates and the Fed's and Treasury's pension for devaluing the currency at the expense of inflating assets are real concerns, but several analysts have suggested that slowing or non-existent economic growth in 2010 will trump these concerns. Money will seek the safety of the greenback, which will be viewed as the best of the worst - i.e., better than other paper currencies.
How can we use this information? 2010 could be the year of capital preservation. A higher dollar implies a struggling economy, which should be a headwind for equities, both domestically and internationally. The same could be said for commodities. After such huge gains for equities and commodities in 2009, a period of consolidation seems likely. A rising Dollar seems to the perfect foil for the equity and commodity markets.
This also seems to square with my 12 month analysis for the S&P500. Over the next 12 months, I am bullish on the S&P500, but it will be important to buy low and sell high or buy when investors turn bearish on equities and sell when they are bullish. We should get those opportunities in 2010.
By Guy Lerner
http://thetechnicaltakedotcom.blogspot.com/
Guy M. Lerner, MD is the founder of ARL Advisers, LLC and managing partner of ARL Investment Partners, L.P. Dr. Lerner utilizes a research driven approach to determine those factors which lead to sustainable moves in the markets. He has developed many proprietary tools and trading models in his quest to outperform. Over the past four years, Lerner has shared his innovative approach with the readers of RealMoney.com and TheStreet.com as a featured columnist. He has been a regular guest on the Money Man Radio Show, DEX-TV, routinely published in the some of the most widely-read financial publications and has been a marquee speaker at financial seminars around the world.
© 2010 Copyright Guy Lerner - All Rights Reserved
Disclaimer: The above is a matter of opinion provided for general information purposes only and is not intended as investment advice. Information and analysis above are derived from sources and utilising methods believed to be reliable, but we cannot accept responsibility for any losses you may incur as a result of this analysis. Individuals should consult with their personal financial advisors.
Guy Lerner Archive |
© 2005-2022 http://www.MarketOracle.co.uk - The Market Oracle is a FREE Daily Financial Markets Analysis & Forecasting online publication.


