


Stock Market Top? Gold to Rise?
Stock-Markets / Stocks Bear Market Jan 08, 2010 - 01:32 AM GMTBy: Brian_Bloom

 Summary: For some weeks this analyst has been unwaveringly bearish flowing from the in-your-face disconnect between the weak underlying fundamentals of the US economy and the short term technical bullishness of the US equity markets. He has consistently argued that what we were witnessing was an upside bounce within a Primary Bear Market – aided and abetted by a Federal Reserve which some analysts have been arguing has been meddling in the markets via its plunge protection team. This view – that we are in a Primary Bear Market – is now being validated.
Brief explanation: “Cognitive dissonance” is a feeling of intense discomfort which manifests when one tries to keep two conflicting ideas in one’s head at the same time. In the short term this discomfort often results in irrational behaviour. In the longer term, Cognitive Dissonance eventually resolves itself either by full blown insanity on the part of the sufferer or by a final decision by him/her regarding which of the two conflicting ideas is true. (Of course, errors of judgment are possible and a wrong decision may flow driven by this need for resolution). With this in mind it is now arguable that sanity may be returning to the markets given that the charts are showing signs of an equity market top. When the key charts are read together what they show may be the first wisps of fear. For example, technically, the gold price chart is stronger than it should be in terms of conventional logic.
What is the proximate cause of this fear? To use an Australian expression, it seems that overseas lenders to the USA might be about to “spit the dummy”. The markets appear to be anticipating that the terms on which overseas lenders are prepared to continue lending to the US may be tightening. If this happens then the US Federal Reserve will be rendered relatively impotent. A paradox outcome of all this is that the US Dollar index might rise strongly.
**************
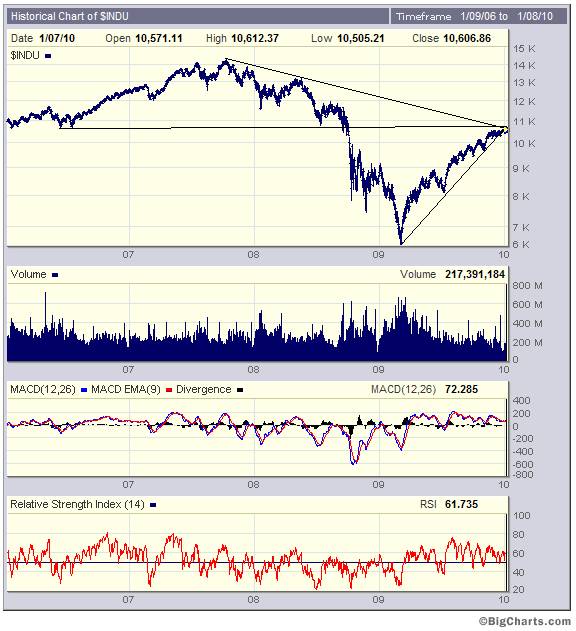
The semi-log daily chart below (courtesy Bigcharts.com) is not encouraging. It shows that the Dow Jones is encountering a strong level of resistance having floated up on falling volume.
For the market to remain bullish (enter a new Primary Bull Trend) volume will have to rise strongly and the price will have to break convincingly above the resistance levels of the two (resistance) trend lines. By contrast, it seems that the bar chart is wanting to roll over and penetrate the rising (support) trend line on the downside.
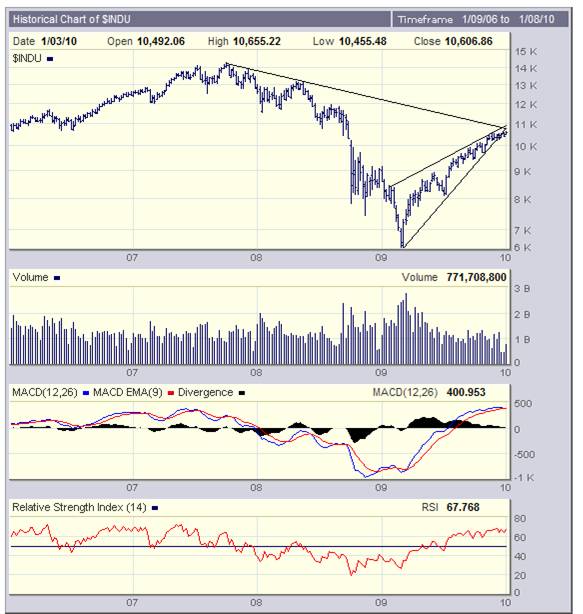
The weekly chart below shows a different perspective of the same picture. Note the bearish rising wedge, the falling tops on the MACD and the position of the blue MA line of the MACD relative to its red MA line. Technically, it might be argued that we are very close to a sell signal.
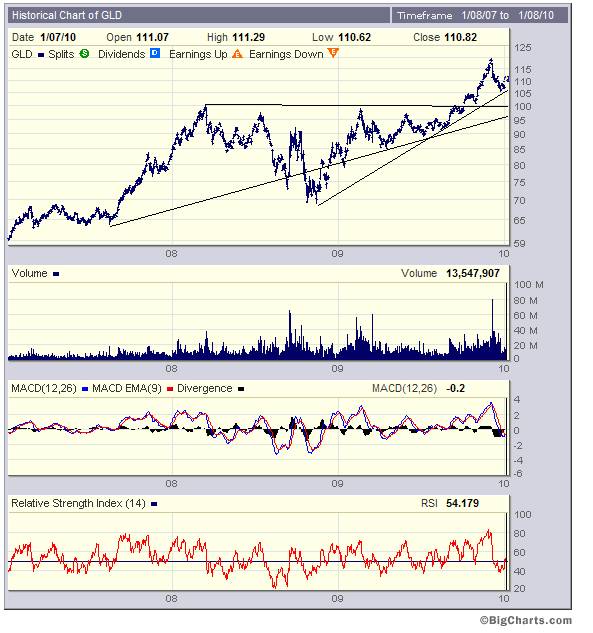
Turning now to GLD (proxy for gold)
It looks like the GLD chart may be on the verge of another short term buy signal (MACD) having already given one two days ago (RSI).
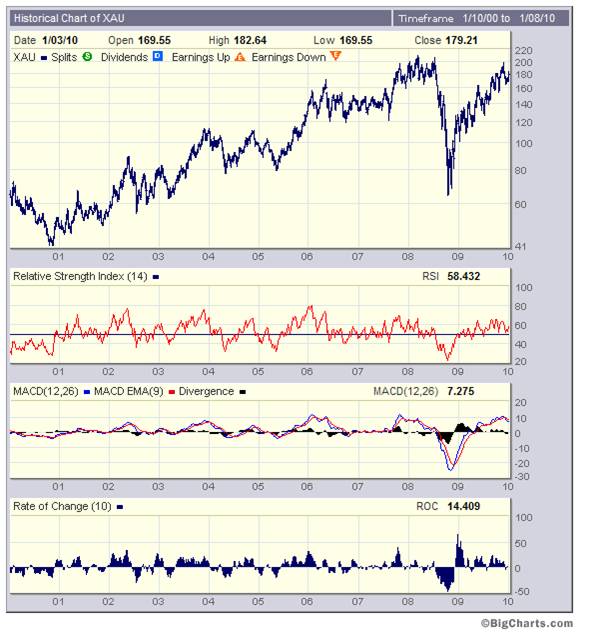
The paradox of these (possible) buy signals is that the XAU is looking toppy. Both the MACD and the ROC have given sell signals
The relative strength chart below (XAU/Gold – courtesy stockcharts.com) shows a weakening XAU relative to gold. Undeniably, this chart has been in a Bear Trend since March 2008 and the three line fan formation shows a progressive weakening of the recent bullishness.
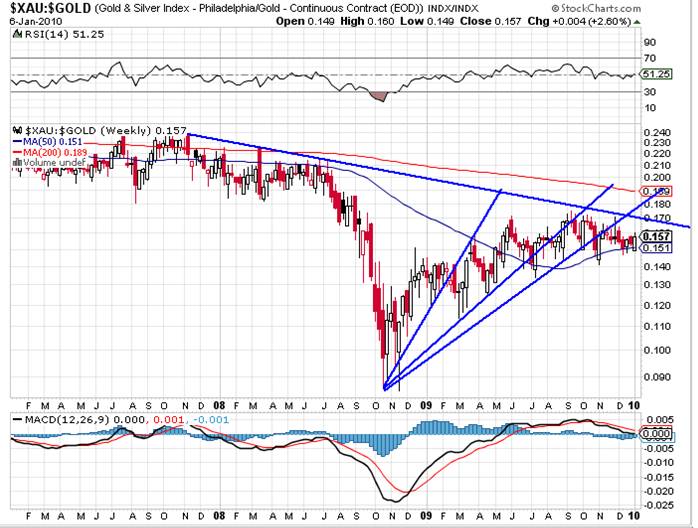
By contrast, the weekly chart of the gold price itself is looking reasonably strong (which appears to be confirmed by the chart of GLD)
Interim Conclusion
If one ignores the daily movements on the Industrial equity charts (which may be prone to manipulation) it appears that the chart of the Dow Jones Industrial Average may be encountering resistance to further rises. This points to the possibility of future downward pressure on share prices and this, in turn, is confirmed by the relative weakness of the XAU.
If gold is strong under the above conditions then, arguably, we may be witnessing the emergence of the first wisps of fear.
Conventional wisdom would argue that if money flows out of the stock market it should flow into the bond market. The chart below (courtesy StockCharts.com) belies this argument
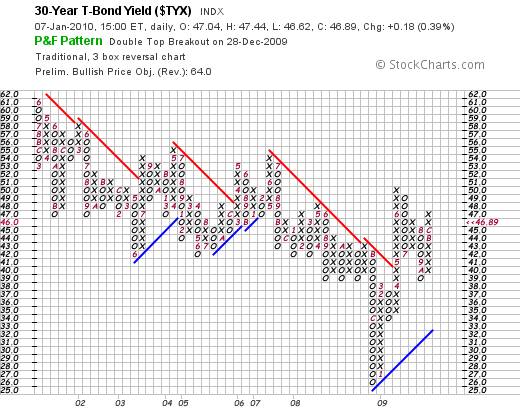
With the most recent column of “x’s” having reached the 47 mark, a buy signal was given on the long dated yield
This buy signal is not yet being mirrored by a sell signal on the chart below (courtesy Decisionpoint.com).
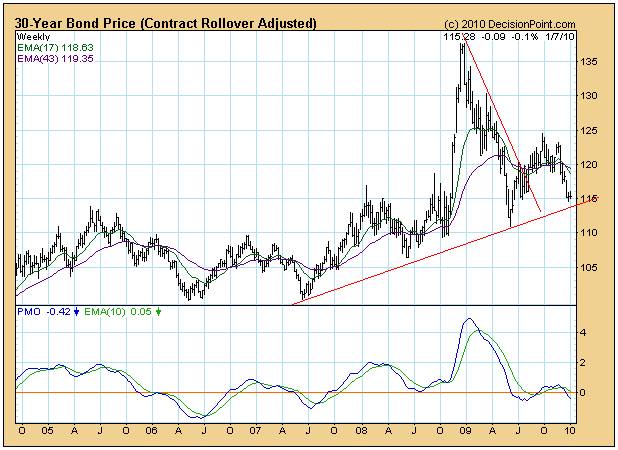
However, closer analysis of the above chart shows two things:
The PMO did give a sell signal (but may still reverse direction)
The 30 year bond price is reaching for support of its rising trend line which may or may not hold
Additionally, this chart also reflects an important subtlety:
Note how the price fell from its peak ( “head”?) to a level below the level of the left hand shoulder/s (?)
If this is in fact a Head and Shoulders formation – and the bond price falls below the rising trend/neck line then the target yield of 6.4% from the Point and Figure measured move count may be real. Could the US (and perhaps the rest of the world) be facing a credit crunch?
A friend sent me the minutes of the December 2009 meeting of the FOMC http://www.federalreserve.gov/monetarypolicy/fomcminutes20091216.htm
Quote: “There was little evidence of year-end funding pressures, although demand for Treasury bills with maturities extending just beyond year-end remained elevated. The Manager also reported on System open market operations in agency debt and agency mortgage-backed securities (MBS) during the intermeeting period. The Desk continued to gradually slow the pace of purchases of these securities in accordance with the program for asset purchases that the Committee announced at the end of its November meeting.”
So if there was little evidence of year-end funding pressures, how can there be a credit crunch?
Well, presumably, the commercial banks did not need additional funds and the Fed’s slow withdrawal of the type of financial support referred to above will not cause undue pain. But what about the Federal Government? Where will it get the funds to pay for its largesse?
Here is a quote from the Casey Report of January 6th 2010:
“Over the most recent 12 months for which there is data (through November 2009), individual income taxes are down 22.4% from the previous 12 months, corporate income taxes are down an astounding 56.5%, and total tax receipts have fallen 17.6%.”
Clearly, if the US Federal Government starts to experience funding difficulties then it will be forced to become increasingly aggressive in the way it funds itself.
And therein lies the rub. What the Federal Government needs is an increase in the inflow of US Dollars into its various bank accounts. This increased dollar flow can either come from borrowing overseas and converting these borrowings into dollars, or it can come from local lenders or it can come from printing more dollars.
The M2 money supply rose by 5.1% to $8.4 trillion for the 12 months to November 2009 (source: http://www.federalreserve.gov/releases/h6/Current/ ) or by roughly $400 billion. Unfortunately, the US Federal budget deficit in 2010 is expected to be well in excess of $1 trillion. Despite popular opinion to the contrary, logic dictates that the shortfall cannot all come from the printing presses because it is self evident that the financial markets will very likely experience an inflationary dislocation.
So where will the money come from?
Typically, money that comes out of the equity market tends to be placed in shorter term instruments. Therefore, once again, logic dictates that the only source to which the US government can (reasonably) turn to fund its cash shortfall is the overseas lenders who will likely charge a higher interest rate because of the higher perceived risks of default. Another consequence of borrowing the money from overseas will be that there will be a mopping up of surplus dollars. Demand for US dollars (to be borrowed by the US Federal government) will rise.
Here is a chart of the US$ (courtesy Decisionpoint.com)
What it shows is a BUY signal on the PMO, a bounce UP from the support of a rising trend line and a break UP from a falling wedge which, in turn, implies that the dollar index might continue rising within a Primary Bull Trend.
In summary, if lenders to the US Federal Government are going to tighten the screws, then there will be an external pressure brought to bear on the USA to stop thinking in terms of printing its way out of its problems. This will be evidenced by:
Rising long dated yields (the expectation of which is being shown on the charts)
Rising demand for US Dollars (the expectation of which is being shown on the charts)
Downside pressure on equity prices as the risk/return equations rebalances itself (the expectation of which is being shown on the charts)
An erosion of confidence in the US Dollar in its capacity as the world’s currency of last resort and a subtle shift towards gold (as is being shown on the gold charts)
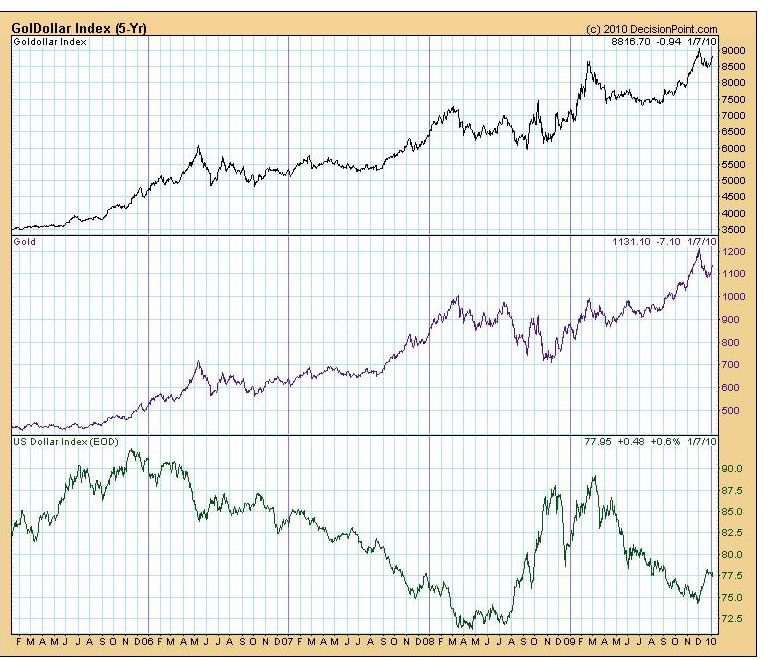
Regular readers will remember that I have been referring to the goldollar index chart below (courtesy DecisionPoint.com) and have been arguing that what this chart may be showing is that both the Gold price and the US Dollar Index may now be in long term bull trends. Clearly, if the dollar is in fact in a long term rising trend it will flow from an imbalance of demand and supply that is not related to its status as a reserve currency.
Overall Conclusion
The partying by a profligate United States of America is drawing to a close. The evidence suggests that lenders to the USA will be taking a tougher stance if they are to continue lending money to fund the US’s deficits. In their own self interests, lenders will likely continue lending provided the Fed curbs its predisposition to print dollars. This will put an upward pressure on both long dated yields and the US Dollar and will put a downward pressure on equities. Gold seems likely to emerge as a serious contender to become part of a global financial solution to address the growing loss of confidence in the purely fiat status quo.
Author comment:
None of the above will lead to any long term solutions to the problems facing the world economy. At its core, the world economy is driven by energy.
The chart below was published in the May 1985 edition of the New Scientist.
At that time (25 years ago) it showed clearly that oil production was expected to decrease and that the world would become increasingly dependent on natural gas for a source of “base-line” energy.
One issue that was not yet a subject of focus by the author of the New Scientist article at that time (Dr Cesare Marchetti) was that China and India had not yet joined the mainstream world economy. This has subsequently transpired and the rate at which energy resources are now being consumed has compressed the time horizons. Some likely consequences of this – and also one directional approach regarding what we might do about it – are discussed in a light hearted format in my novel, Beyond Neanderthal, which can be ordered via the web link below or via Amazon. I am currently researching the subject of nuclear fission as a possible alternative source of baseline energy but this subject is fraught with complexities. There can be no “sound bite” solutions in this regard. At current work load I estimate that it will require up to three more years before my next novel - with nuclear fission as its primary theme – will see the light of day.
At the end of the day, the solution to our baseline energy problems almost certainly lies inside the atom – one of Nature’s building blocks – and the question that this begs is: What technology should we be using to access this energy? It is clear that nuclear fission is one option and there are various technical options within that option. But, as is discussed in Beyond Neanderthal, magnetically oriented technology for scavenging energy from within the atom may be another conceptual approach. Think about this: When you ask a physicist to explain magnetism he will typically refer to Maxwell’s equations which describe very precisely how magnetism works. But try asking that same physicist to explain “why” magnetism works. Why is a magnet surrounded by a magnetic field? What is the source of this magnetic field? Typically, when I ask these particular questions, all I get is waffle. So let’s not be in such a hurry to dismiss magnetism as an option. Let’s keep our minds open for the time being.
By Brian Bloom
Once in a while a book comes along that ‘nails’ the issues of our times. Brian Bloom has demonstrated an uncanny ability to predict world events, sometimes even before they are on the media radar. First he predicted the world financial crisis and its timing, then the increasing controversies regarding the causes of climate change. Next will be a dawning understanding that humanity must embrace radically new thought paradigms with regard to energy, or face extinction.
Via the medium of its lighthearted and entertaining storyline, Beyond Neanderthal highlights the common links between Christianity, Judaism, Islam, Hinduism and Taoism and draws attention to an alternative energy source known to the Ancients. How was this common knowledge lost? Have ego and testosterone befuddled our thought processes? The Muslim population is now approaching 1.6 billion across the planet. The clash of civilizations between Judeo-Christians and Muslims is heightening. Is there a peaceful way to diffuse this situation or will ego and testosterone get in the way of that too? Beyond Neanderthal makes the case for a possible way forward on both the energy and the clash of civilizations fronts.
Copies of Beyond Neanderthal may be ordered via www.beyondneanderthal.com or from Amazon
Copyright © 2010 Brian Bloom - All Rights Reserved
Disclaimer: The above is a matter of opinion provided for general information purposes only and is not intended as investment advice. Information and analysis above are derived from sources and utilising methods believed to be reliable, but we cannot accept responsibility for any losses you may incur as a result of this analysis. Individuals should consult with their personal financial advisors.
Brian Bloom Archive |
© 2005-2022 http://www.MarketOracle.co.uk - The Market Oracle is a FREE Daily Financial Markets Analysis & Forecasting online publication.