


S&P500 Stocks Index Long Term Technical Outlook
Stock-Markets / Stock Markets 2010 Jan 02, 2010 - 12:17 PM GMTBy: Guy_Lerner

Looking out over the next 12 months, my outlook for the S&P500 is bullish. This may surprise many of you as I have had a cautious bent for the better part of six months now, and I have been writing about selling something, anything for the past 6 weeks.
Make no mistake about it, this market needs a correction, and with the market looking toppy, I believe we are nearing the point that a correction will begin. So despite my 12 month bullish outlook, I would not make an out sized allocation to equities until investor sentiment (as measured by the "Dumb Money" indicator) turns bearish (i.e., bull signal). How deep should the correction be? I don't have a clue. Any pullback will likely find willing buyers - especially when investor sentiment turns bearish (i.e., bull signal). This much is a given. The correction will not be the end of this bullish run that started in March, 2009; it will be a buying opportunity.
While it seems obvious that any meaningful correction will lead to a buying opportunity -as it usually does - the longer term perspective suggests that markets won't roll over so easily, and to understand why this is so, we need to look at a monthly chart of the S&P500. See figure 1.
Figure 1. S&P500/ monthly
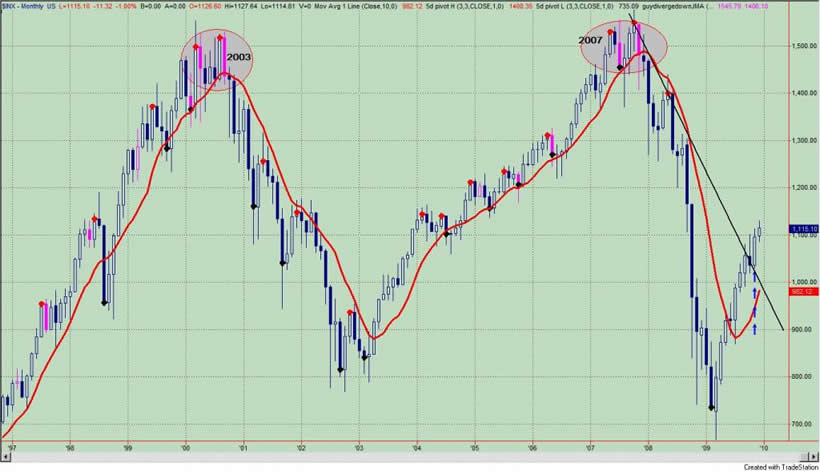
The red and black dots on the price bars are high and low pivot points, respectively. If we draw a trend line from the two most recent pivot high points, we note that the S&P500 broke this trend line back in November (see the blue up arrows on the graph). This is bullish. How bullish? This price behavior - a break of a down sloping trend line - is bullish enough to suggest that we will not have a market top of significance until there are a clustering of negative divergence bars (see pink marked price bars with ovals on price chart at 2000 and 2007 tops) or there is a close below a pivot low point. (Of note, this price behavior is fairly consistent across decades of price data when looking at the S&P500, Dow Jones Industrials, NASDAQ, and Russell 2000.)
The clustering of negative divergence bars implies slowing upside momentum, and we are at least two months away from possibly developing our first one. One negative divergence typically implies a trading range. While several negative divergence bars implies the strong possibility of a market top. In addition, as the market has gone straight up since March, there are no pivot low points, and the bounce following the first pull back (if and when it comes) is likely to create one. If the markets were to close below this pivot low point, then it will be another bear market.
All this is going to take time. So my bullish "call" is more like I cannot get too bearish on this market in the long term. If we are going to have a market top of significance that leads to a bear market, then that top, which leads to a rollover in prices, is going to take months to develop. It is that simple.
By the end of the year, the S&P500 may not be higher, but it is unlikely to be too much lower. At some point, there will be a correction, which should be a good buying opportunity. To me, a good opportunity means that risk will be well defined and reward or upside potential will be worth playing for. And if history is any guide, we should have about 2 good buying opportunities next year.
For equities, I cannot see the secular bear market resuming without a prolong period of discourse.
By Guy Lerner
http://thetechnicaltakedotcom.blogspot.com/
Guy M. Lerner, MD is the founder of ARL Advisers, LLC and managing partner of ARL Investment Partners, L.P. Dr. Lerner utilizes a research driven approach to determine those factors which lead to sustainable moves in the markets. He has developed many proprietary tools and trading models in his quest to outperform. Over the past four years, Lerner has shared his innovative approach with the readers of RealMoney.com and TheStreet.com as a featured columnist. He has been a regular guest on the Money Man Radio Show, DEX-TV, routinely published in the some of the most widely-read financial publications and has been a marquee speaker at financial seminars around the world.
© 2009 Copyright Guy Lerner - All Rights Reserved
Disclaimer: The above is a matter of opinion provided for general information purposes only and is not intended as investment advice. Information and analysis above are derived from sources and utilising methods believed to be reliable, but we cannot accept responsibility for any losses you may incur as a result of this analysis. Individuals should consult with their personal financial advisors.
Guy Lerner Archive |
© 2005-2022 http://www.MarketOracle.co.uk - The Market Oracle is a FREE Daily Financial Markets Analysis & Forecasting online publication.