


U.S. Dollar Grinds Higher after Convincing Breakout
Currencies / US Dollar Dec 20, 2009 - 11:28 AM GMTBy: Mark_Brown

 Sometimes, as traders, we need to stop and do a double-take, especially when a long-depressed commodity or currency suddenly begins to rise sharply. In the case of the US Dollar index (DX), there were most likely thousands of double-takes, as disbelieving traders took a second, third and even a fourth glance at this key currency’s daily and weekly charts. Yes, this Dollar breakout appears to be the real deal, one destined to run even higher in the weeks just ahead, and it might pay for us to invest a little time now and see if we can anticipate the Dollar’s next area of significant overhead resistance.
Doing so might even help those of us who plan to re-enter the Gold market (on a cash, ETF or futures contract basis), hoping for a short-term bounce higher when the Dollar eventually meets up with more formidable resistance. Let’s have a look at the weekly chart of the continuous US Dollar Index futures contract (traded on the ICE exchange) to see what technical clues are being offered to us right now.
Graphics credit: Metastock v.11
The Dollar break seems to be carrying all of the proper technical credentials that might allow it to morph into a major trend reversal (at some point), Here are a few of them:
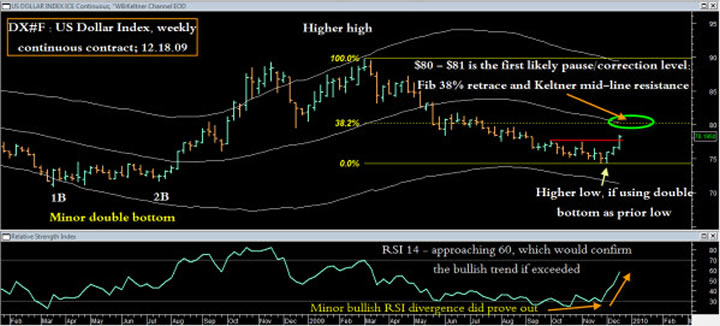
1. The weekly relative strength indicator (RSI (14)) is rising at a very sharp angle of attack and is just a little below the 60 level; should it increase beyond 60, it would be a substantial confirmation of a strong weekly trend. Notice how the RSI was also manifesting a minor bullish price/momentum divergence prior to the Dollar’s turn higher.
2. Since we all know that the price of the Dollar Index generally moves inversely to the price of Gold, the fact that Gold was anticipated to meet up with very strong weekly and monthly resistance near $1,200 (before plunging by more than $100 over the past two weeks) also offered additional confirmation to this recent Dollar up thrust
3. Notice how the Dollar Index formed a minor double bottom pattern during early-to-mid 2008 (1B and 2B on the chart) before mounting a strong bear market rally as the 2008’s giant commodity bubble was disintegrating. Now look at the price level of the recent Dollar Index low at about $74.21, which is nearly $4 higher than the dead low made during 2008’s double bottom. This means that a higher low has just printed, which is also adding a substantial amount of bullish fuel to this Dollar rally, especially since an up trend is, by definition, characterized by a series of higher highs and higher lows.
4. Trader/investor sentiment in the Gold futures market (as interpreted by way of recent Commitment of Trader (COT reports, put out by the CFTC every week) had been exceedingly (and unrealistically) bullish among large speculators (hedge funds) and small traders, suggesting that a significant correction was imminent. Not surprisingly, the exact opposite situation existed in the US Dollar Index’s COT sentiment interpretation – the large speculators had only just begun to acquire fresh long Dollar positions, meaning that the stage was being set for a complete ‘about face’ in both of these critical investment/commodity markets.
Presently, the Dollar Index appears to be making a beeline toward the major resistance zone near $80.50, a full $3.20 above its current reading of $78.195. This is an important area of resistance ‘confluence,’ meaning that two or more technical tools are in agreement that a particular time/price area should act as a support/resistance (S/R) barrier. Those two indicators include the Fibonacci 38% retracement of the major March 2009 thru November 2009 downswing and the Keltner band mid-line (white curved line), which happens to be a 45-week exponential moving average (EMA). Reasonably, we can expect to see the DX at least pause and rest near that resistance, but only time will tell if that will initiate a correction or a period of sideways consolidation before continuing higher. Gold bulls should monitor for strong areas of support in Gold (1090 –1070 on the weekly time frame) if the DX reaches $80-$81, looking for possible daily-based long swing trade setups in the yellow metal.
The broad US markets are also very vulnerable to a substantial decline of their own, given that the S&P 500 index has been moving inversely to the Dollar index for the past nine months or so. Should this inverse correlation continue, and the Dollar index keeps on rising, savvy traders might start to investigate the possibility of shorting the weakest stocks from the weakest market sectors in the S&P 500 or Russell 2000 indexes.
Long-term, the abysmal fundamental outlook for the US Dollar don’t seem likely to get much better, at least not until the flood of deficit spending is brought under some semblance of control. However, the US Dollar has already experienced two powerful bear market rallies since early 2005, and this current move certainly looks like it has the makings of rally number three. It should be a very interesting New Year for both Dollar and Gold Bulls!
By Mark Brown
To receive more information on trading ETF funds visit my website: www.ETFTradingPartner.com
Mark Brown is an independent trader who focuses on trading ETF funds. He has been involved in markets and money management since 1998. His unique trading model which uses a combination of analysis like: economy, market cycles, chart patterns, volume, market internals, and money management. Visit his site: ETF Trading Partner www.ETFTradingPartner.com
© 2009 Copyright Mark Brown - All Rights Reserved Disclaimer: The above is a matter of opinion provided for general information purposes only and is not intended as investment advice. Information and analysis above are derived from sources and utilising methods believed to be reliable, but we cannot accept responsibility for any losses you may incur as a result of this analysis. Individuals should consult with their personal financial advisors.
© 2005-2022 http://www.MarketOracle.co.uk - The Market Oracle is a FREE Daily Financial Markets Analysis & Forecasting online publication.