


Gold Blow Off Rally in for Rough Sailing Ahead
Commodities / Gold & Silver 2009 Dec 05, 2009 - 02:29 PM GMTBy: Merv_Burak

 That “blow-off” line shown last week has been breached this Friday and I’m afraid we’re in for some rough sailing ahead, at least for a little while. It will take some time for the indicators to suggest what’s happening but let’s go right to them and see what they are saying at this time.
GOLD : LONG TERM
It takes some time for the long term indicators to turn around and confirm any kind of trend reversal. Reversals are first noted in the short term indicators and progressively move over to the longer periods as time goes by. At the present time Friday’s action, along with the previous Friday’s action, does not in and of itself suggest a long term trend reversal but it does say something in the shorter periods (see below).
Although the long term P&F chart is now moving in a downward direction it is still far away from any reversal signal. Even if it goes straight down from here it would have to drop to the $1020 level for a reversal. Of course, should the action in the days and weeks ahead cause the P&F chart to reverse direction again then we may get a higher level at which the P&F would give a reversal signal.
Gold price, despite Friday’s plunge, is still some $160 above its long term positive sloping moving average line and therefore nothing yet to worry about from the long term standpoint. The long term momentum indicator remains well inside its positive zone but Friday’s action HAS caused the indicator to move below its trigger line. The trigger line is in the process of turning down but as of Friday’s close it is still very slightly pointing upwards. At the present time this momentum indicator is just giving us the very early initial indications of reducing strength, from the long term perspective. The volume indicator remains very much positive and well above its positive trigger line. On the long term the rating remains BULLISH.
INTERMEDIATE TERM
The FAN Principle trend lines shown last week took almost 5 months to fully develop. As such I consider the lines as intermediate term indicators. With the breaking of that third FAN trend line (i.e. a close below the line) we now have one indicator that gives us a bearish intermediate term signal. As this was a “blow-off” line the break is very often accurate. What does it foretell? Well, basically that we are into a declining market ahead. As this is an intermediate term signal I would not consider it a death sign for the long term but just a rough ride for the next few weeks, at the least. To go beyond that we would have to wait for further on going indicators.
The (Merv’s) FAN Principle provides a reversal signal very, very close to the reversal top. It is one of very few indicators that does so. It is not perfect but one would be very foolish to go counter to its message, at least until the signal is nullified by a move to new highs in a short period of time.
As for the normal intermediate term indicators, they are still mostly positive. The FAN Principle signal is normally so far ahead of the usual indicator one might wonder about the value of the usual indicators. Well, we do not get a FAN Principle pattern very often so we have to go with the next best. One should be watching that the usual indicators are starting to move towards the same signal already given by the FAN.
The gold price remains well above its positive intermediate term moving average line but they are starting to get closer to each other. The momentum indicator had moved into its overbought zone during the week, started to level off on Thursday and dropped below its overbought line on Friday. It also dropped below its trigger line and the trigger has turned downward. So, from a strength standpoint the indications are that the strength is decreasing, although still positive. The volume indicator remains positive and above its positive trigger line. The intermediate term rating remains BULLISH at this time.
SHORT TERM
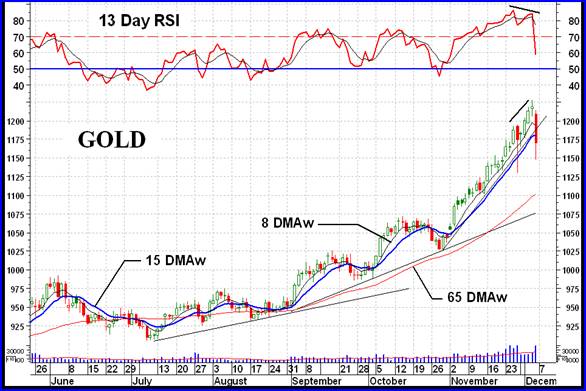
Friday’s action, although scary, has not changed the picture much as far as the normal indicators are concerned. We see how far above the intermediate term moving average line that the short term line is. Still far from confirming an intermediate term reversal. The same is true as far as the distance between the very short term and short term lines are, for short term reversal confirmation.
On the short term we have the price of gold dropping below the short term moving average line and the line turning towards the negative but not quite there yet. The momentum indicator has dropped below its trigger and the trigger line has turned downward but the momentum itself is still in its positive zone, for another day or so. The short term rating has started to move towards the bearish but not quite yet. It has gone to the – NEUTRAL level today.
Two interesting points about this week’s short term chart. First is the short term momentum indicator. As we see, as the price rose to new highs during the week the strength of such move was diminishing. We ended with a short term negative divergence resulting in the plunge of Friday. The second feature is the daily volume action. Over the past month the volume has been steadily improving as the price rose. On most of the days the daily volume was in excess of the short term (15 day) average volume (red line). This past week the daily volume was very low as the price continued to move higher. Again, another sign of weakness in the price move to new highs. One can never tell ahead of time when such indications prove accurate but given such warning signs one might restrict ones actions until such signs either are negated or proven to be accurate.
SILVER
First of all that silver P&F chart shown here two weeks ago is still nowhere in trouble of reversing. It has now gone through its first two projections and was on its way to the next, at $24.00.
Although silver is showing weakness and has a decidedly negative divergence in its intermediate term momentum indicator it has not yet broken its up trend line from the late Oct low, as has gold. In addition, we do not have a FAN Principle set of trend lines but the primary up trend line from the July low, which started the FAN trends in gold, is more of a basic up trend line with three lows at its support, the July low, the August low and the late October low. Although we do have a short term up trend line from the Oct low the one to watch would be this primary one.
Without going into details the indicators and ratings for silver are very much similar to those of gold so one can go to the gold commentary to see what is happening to silver.
PRECIOUS METAL STOCKS
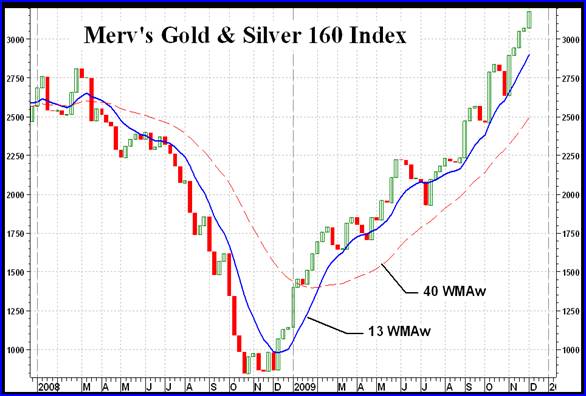
The Index shown this week is that of my universe of 160 gold and silver stocks. It reflects the AVERAGE weekly performance of all 160 stocks in the Index, no one stock has a higher weighting towards the Index calculation than any other. This Index includes the top 100 stocks traded on the North American markets, based upon market value. An additional 60 stocks of a more speculative nature are also included. It had include some penny stocks but I have taken most, if not all, of these out and developed a separate Merv’s Penny Arcade Index, which I show and comment upon in this section from time to time. This Index of 160 stocks started its bull market in Aug of 1998, a couple of years before most other Indices started, and was already up more than 100% before the start of the gold bull market. Since the start of its bull move this Index has advanced 7420% to this Friday’s close. Not bad for an average of 160 stocks.
For a year the Index was trying to make a decisive move through the 2800 level before finally succumbing to the bear. Here we see the bear market of 2008 and the new bull market of 2009, going into new all time highs.
For comparison, the best performer of the major North American Gold Indices was the AMEX Gold BUGS Index. This Index gained 1187% from the start of its bull market. None of the major Indices have yet made it back into new all time highs.
What this seems to suggest is that the gold stocks, in general, have made spectacular gains, much better than most analysts may suggest. These gains are mostly in the more aggressive stocks where the real gold stock action is. One is missing out on real gains if one does not have some speculative stocks in their portfolio. Yes, I know, as many would point out the speculative stocks are inclined to fall a lot when the bear comes. See; look at the 160 Index and the decline of 2008. BUT, the “quality” Index, the PHLX Gold/Silver Sector Index also declined during the same period and by almost the same amount. The 160 Index declined 70% from the top to the low of 2008. The PHLX declined 66% during the same period.
ALL STOCKS are prone to decline during bear markets. BUT why should one be holding on to stocks during a decline. There are many techniques, mostly technical, that would warn you a major decline is in the works. Get out, sit back, have a beer, watch TV or go to the theatre and get back in when the decline is over.
The best time, and the least risky time, to buy stocks is after a major decline has occurred and the stocks have started their advance. The worst time to get into the market (on the buy side) is after a major advance and the stocks have started to decline. The second worst, or most risky, time to buy is after a major advance has already taken place. You are then getting closer and closer to a top. There might still be many stocks that will show good performances but the risk factor has been greatly increased. UNFORTUNATELY, we are now at a very risky time to be getting into the market. The risk has gone up greatly since late last year.
My most speculative Index is, of course, the Merv’s Penny Arcade Index. This Index is now giving me a serious negative divergence message in its momentum indicator. Gambling in the pennies is now becoming more and more of a risky venture. There may be a top and significant decline in these stocks ahead. One needs to follow the action closely over the next few weeks to see how this develops. As goes the Pennies, so, sometimes later, go the rest of the gold stocks.
MERV’S PRECIOUS METALS INDICES TABLE
Well, I think I’ll call it a another week.
By Merv Burak, CMT
Hudson Aero/Systems Inc.
Technical Information Group
for Merv's Precious Metals Central
For DAILY Uranium stock commentary and WEEKLY Uranium market update check out my new Technically Uranium with Merv blog at http://techuranium.blogspot.com .
During the day Merv practices his engineering profession as a Consulting Aerospace Engineer. Once the sun goes down and night descends upon the earth Merv dons his other hat as a Chartered Market Technician ( CMT ) and tries to decipher what's going on in the securities markets. As an underground surveyor in the gold mines of Canada 's Northwest Territories in his youth, Merv has a soft spot for the gold industry and has developed several Gold Indices reflecting different aspects of the industry. As a basically lazy individual Merv's driving focus is to KEEP IT SIMPLE .
To find out more about Merv's various Gold Indices and component stocks, please visit http://preciousmetalscentral.com . There you will find samples of the Indices and their component stocks plus other publications of interest to gold investors.
Before you invest, Always check your market timing with a Qualified Professional Market Technician
Merv Burak Archive |
© 2005-2022 http://www.MarketOracle.co.uk - The Market Oracle is a FREE Daily Financial Markets Analysis & Forecasting online publication.