


The Recurring Gold Price Bubbles
Commodities / Gold & Silver 2009 Dec 02, 2009 - 01:16 PM GMTBy: Tim_Iacono

 A lot of people are getting all worked up about the rising price of gold. Some say the current move has gone "parabolic" and that we're in the midst of a "blow-off top" akin to the early 1980s peak that saw the gold price disappoint investors for years afterward.
Just this morning, Hu Xiaolian, a vice-governor at the People's Bank of China, called gold a bubble and implied that the central bank wasn't much interested in buying thousands more tonnes of bullion as bank reserves at current prices.
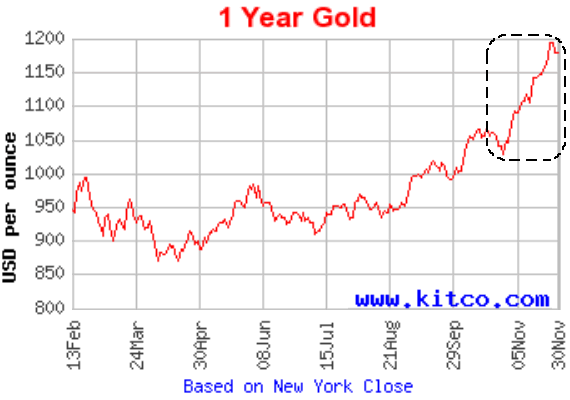
Looking at the one-year gold chart below it's hard to disagree with that view, but there's much more to the story than that. In fact, as compared to previous moves up in this decade, the recent move has been rather tame so far for reasons that will be explained in a minute.
Since the yellow metal began its decade-long ascent in 2000, there have been distinct periods of rising prices, most of which have begun in the odd numbered years, peaking in the even numbered years as indicated below.
The moves up in the 2001-2004 period are a bit difficult to see, coming off of a long bottoming process, however, the last three surges are so easily identifiable, it seems reasonable to just look at these three to see how the recent surge in the gold price compares.
At first glance, the most recent ascent looks like a smallish version of the last two, however, the steepness of the curve, not its duration, is probably what has people calling this a bubble.
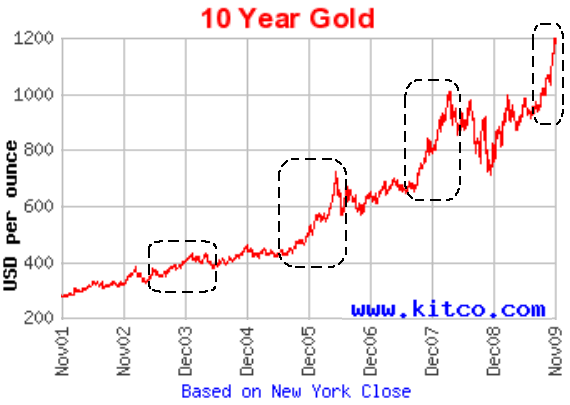
If it is a bubble, based on the graphic above, it would clearly be the third bubble in the last six years which would call into question the use of the term "bubble" in the first place.
But, what is critically important when comparing the last three moves up for the gold price is to note the scale on the chart. For example, some quick math reveals that the 2005-2006 move from just over $400 an ounce to $725 was a gain of some 70 percent and this occurred during a relatively calm period when central banks were still selling their gold reserves as fast as they could and the entire world still thought it was getting rich due to rising asset prices.
The 2007-2008 jaunt from the high $600 range to just over $1,000 was a surge of about 50 percent which took a few months less to accomplish than the prior move. This occurred when there was growing fear of inflation but the sustainability of the global financial and monetary system was not being widely challenged as it is today.
Depending upon how you measure it, the most recent move only amounts to about 30 percent, though you can surely get a larger number if you start the measurement in late-2008 when the entire financial world looked like it was in the process of imploding.
In fact, picking starting points that were the "final lows" for each of the three cycles described above (a judgment that, admittedly, is somewhat arbitrary), the picture looks like this, the current "bubble" appearing to be still something of a "baby bubble".
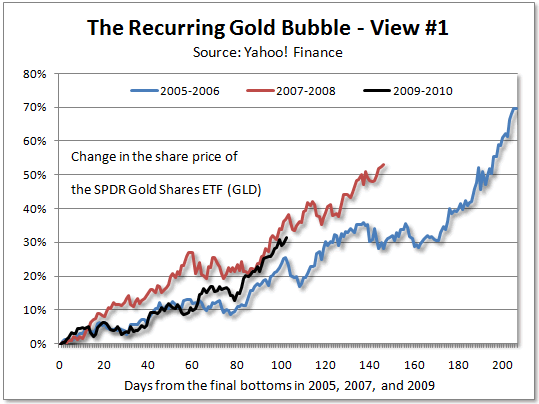
While slightly ahead of the 2005-2006 move at only half its duration, it is still back of the pace set in 2007-2008 and 40 trading days short of a similar peak.
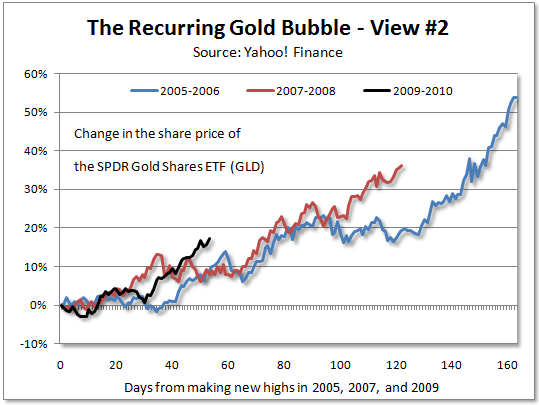
There are likely many ways to compare these three periods, but, since they are all clear stretches of surging prices followed by a consolidation and then another move up, probably the fairest way to look at them is to measure from the time that a previous high had been surpassed until a new peak was reached.
For those of you with a Kitco.com page open on your browser at home, those starting points would be mid-September 2005, early-September 2007, and just a few months ago in - you guessed it - September 2009.
Here too, the current run-up is just a pipsqueak, ahead of the other two at this stage in the game but, overall, still looking pretty wimpy.
I don't know. If this is a gold bubble, it's unlike any other bubble that I've ever come across because it keeps happening over and over.
Normally, after a bubble reaches its maximum point of inflation and pops, it stays popped and doesn't begin to inflate again for many years or even decades - think Nikkei stocks in 1989, Nasdaq stocks in 2000, and housing in 2005. None of these bubbles show any real sign of inflating again, though, with all the money printing over the last year or so, anything is possible.
No, if the current move up in gold is a bubble it has to be some kind of new "recurring" bubble that offers better prospects for those wondering whether they should be buying the metal at more than $1,200 an ounce - if the bubble does burst sometime in the months ahead, given what's happened in recent years, it's likely to inflate again at some point, probably in September of 2011.
Of course, governments around the world could probably put an end to these recurring gold bubbles if they took Paul Volcker-like tough-love measures to restore confidence in paper money once and for all.
But, realistically, given today's decision makers, there are probably only two chances of that happening - slim and none, slim reportedly having just left town.
By Tim Iacono
Email : mailto:tim@iaconoresearch.com
http://www.iaconoresearch.com
http://themessthatgreenspanmade.blogspot.com/
Tim Iacano is an engineer by profession, with a keen understanding of human nature, his study of economics and financial markets began in earnest in the late 1990s - this is where it has led. he is self taught and self sufficient - analyst, writer, webmaster, marketer, bill-collector, and bill-payer. This is intended to be a long-term operation where the only items that will ever be offered for sale to the public are subscriptions to his service and books that he plans to write in the years ahead.
Copyright © 2009 Iacono Research, LLC - All Rights Reserved
Tim Iacono Archive |
© 2005-2022 http://www.MarketOracle.co.uk - The Market Oracle is a FREE Daily Financial Markets Analysis & Forecasting online publication.