


U.S. Dollar Index May Hold Some Nasty Surprises for Carry Trade Participants
Currencies / US Dollar Nov 28, 2009 - 05:32 PM GMTBy: Brian_Bloom

 Summary and Conclusions -
The US Dollar Index is showing signs of wanting to bottom out and this has seriously adverse implications for those who have been speculating with US Dollar carry trades. It may also be pointing to the imminent resumption of the Primary Bear Trend in Industrial Equities. The gold price may consolidate at these levels within the context of a Primary Bull Market. i.e. Both the US Dollar Index and the Gold Price might be argued to be in Primary Bull Markets.
Summary and Conclusions -
The US Dollar Index is showing signs of wanting to bottom out and this has seriously adverse implications for those who have been speculating with US Dollar carry trades. It may also be pointing to the imminent resumption of the Primary Bear Trend in Industrial Equities. The gold price may consolidate at these levels within the context of a Primary Bull Market. i.e. Both the US Dollar Index and the Gold Price might be argued to be in Primary Bull Markets.
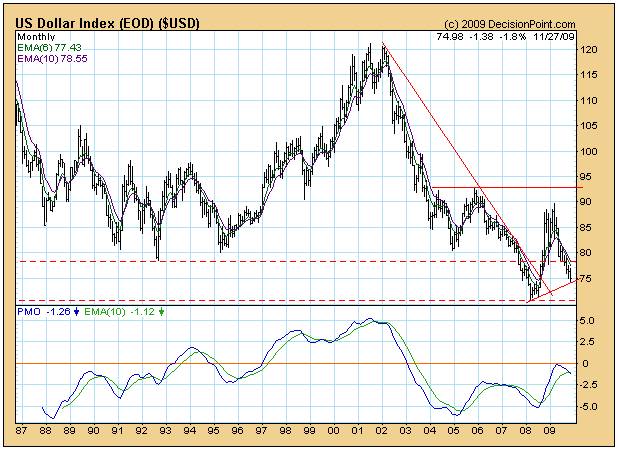
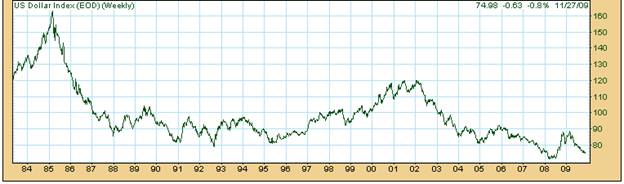
The two charts below (courtesy DecisionPoint.com) show that the US Dollar Index has reached the support of the upward sloping trend line and has bounced up.
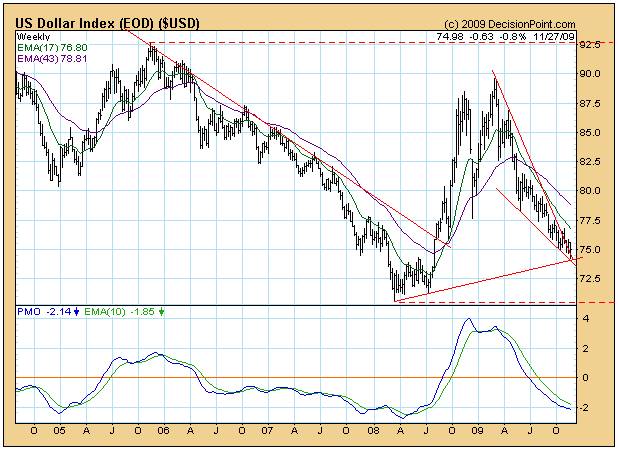
Note how the closing price on the weekly chart has been above the confines of the descending trend line for the third time in four weeks.
The chart below is the weekly chart of the gold price.
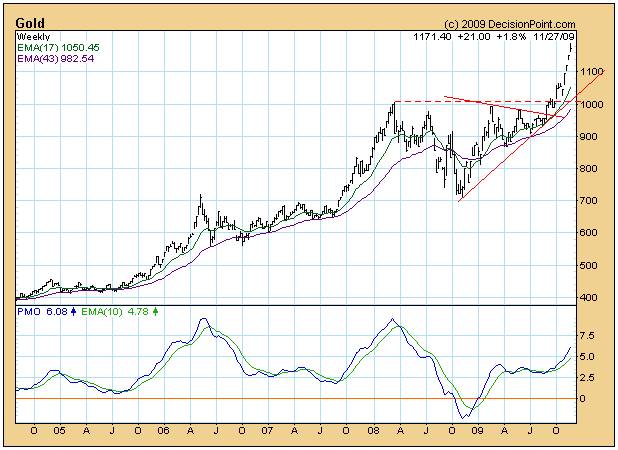
The most recent gap (the midpoint of which was roughly at $1,160 per ounce) implies a target move to a destination of $1,160 + ($1,160 - $1,140) (the midpoint of the previous move) = $1,180.
Given that $1,180 has been reached from a technical perspective and given that the gold price closed off its peak, we might see some consolidation in the gold price in the short term.
Which brings us to the Goldollar Chart (also courtesy DecisionPoint.com):
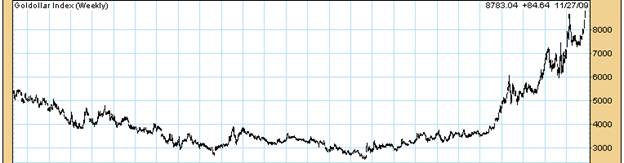
Note how it has broken through the resistance of the double top to a new high.
Given that the GolDollar Index is derived by multiplying the gold price and the Dollar Index, the only way for the GolDollar Index to continue travelling north in the short term is if the US Dollar Index rises at a faster rate than the Gold Price falls. (The two alternatives are that the gold price rises faster than the Dollar Index falls or that they both continue to rise).
There is one potential technical reason that the GolDollar Index could top out here and that is the gap that can bee seen at around 850. This “might” be covered. However, there is another gap at around 720 and this gap has not been covered. If the first gap is a breakaway gap and the second gap is a runaway gap then the distance between these two (850 – 720 = 130) may be used to determine the target destination of the move. i.e. 850 + 130 = 980.
Why would the US Dollar Index begin to rise from here?
This has been discussed in previous editorials. The “catalyst” to a rise might be vigorous support activity by those who stand to lose the most if the US Dollar falls further. The “momentum” for further rise might be an unwinding of dollar carry trades. (Speculators have been borrowing US Dollars at low interest rates in the US and investing them at higher interest rates overseas).
But here’s the thing: a projected 130 move from a base of 850 would represent a 15% up move. If this occurred because the Dollar was moving up whilst the gold price was marking time then there would be no way the participants in the dollar carry trade could avoid massive capital losses. A short squeeze (and rivers of blood on the floor) may be the final outcome.
Let’s take another look at the weekly chart of the US Dollar – the one with the falling wedge that couldn’t possibly be a genuine falling wedge because a falling wedge is a consolidation pattern in a primary bull market.
The theory behind wedges is that once a breakout occurs, the minimum distance of travel that can be anticipated (no time horizon) would be back to the point at which the wedge commenced – in this case, around 90. If the US Dollar Index rose from its current level of 75 to the 90 destination it would move 15/75 = 20%. That being considerably more than 15%, an implication might be that the gold price might fall a few percentage points before consolidating.
Conclusion
If the double top formation of the GolDollar Index Chart has indeed been penetrated to the upside and if this breakout is confirmed, then one technical implication will be that both the US Dollar Index and the Gold Price are now in Primary Bull Markets.
Author Comment
It’s too early to take definitive action on the above “conclusion” because the breakout from the double top has not yet been confirmed and it may turn out to be a false breakout. But let’s take the logic a bit further.
Let’s look at what the technical relationship has been between the US Dollar Index and the Dow Jones Industrial Index.
Have a look at the weekly chart below of the ratio of the Dow Jones to the USD Index (courtesy Stockcharts.com)
Note how the RSI oscillator is reaching for overbought territory and note also how the MACD histograms have been contracting.
Note also the gap that occurred at around the 85 mark. This gap (breakaway) was followed by another gap (runaway) at around 100. The target of 115 has been reached.
The reader’s attention is now drawn to the downward spike which culminated at around 74 before the market started to rise again relative to the US Dollar Index. Arguably, that spike represented the head of an inverse head-and-shoulders pattern with the neckline clearly visible at 110. The measured move target of 110 + (110-74) = 146 has yet to be reached and may never be reached for reasons outlined below.
The reader’s attention is also drawn to the gaps that manifested on the downside at around 140 and again at 128 as the market collapsed in September/October 2008. Those gaps have now been covered.
On balance, it appears from a technical analysis of the above Relative Strength chart that:
It is overbought
The recent rise may well have been a technical reaction within a Primary Bear Market given that the gap at 140 has now been covered
The recent “upside” volatility may be drawing to a close
The Dow Jones Industrial Index might very well pull back relative to the US Dollar Index
If we now turn our attention to the Dow Jones Index on its own (courtesy BigCharts.com), we see the following:
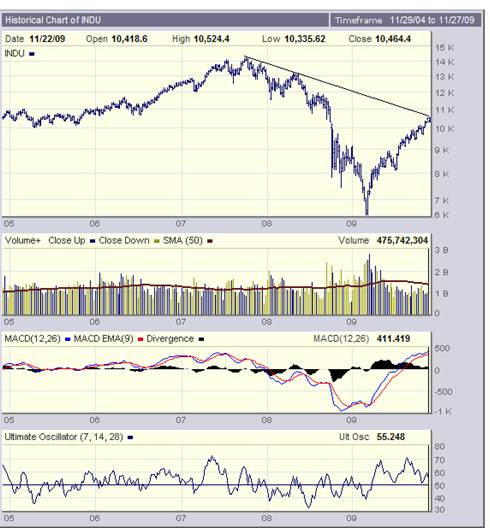
The Industrial Index is encountering resistance as it has bounced down off the falling trend line (bearish)
The price has recently been rising in the face of falling volume (bearish)
The MACD histograms have been shrinking back towards the zero line even as the Moving Averages of the MACD have been reaching for overbought territory (bearish)
The Ultimate Oscillator has shown a series of four descending tops (bearish)
Overall Conclusion
It is still very early days but the charts are pointing to the possibility of some nasty surprises ahead. The US Dollar has been showing signs of wanting to bottom out and a short squeeze may cause significant financial losses for those who have been “gambling” in US Dollar carry trades. If the US Dollar rises, this might well be accompanied by a topping out of the Industrial Equity markets which has become overstretched and which, because it is below its trend line, is still technically in a Primary Bear Market. Whilst the index trades below this trend line the Primary Bear Market is an objective fact which is not open for debate. Whether or not this Primary Bear Market will reverse itself is open to debate, but the fundamentals do not support such an expectation.
Today is the tomorrow we were worrying about yesterday, and all is not well.
By Brian Bloom
Once in a while a book comes along that ‘nails’ the issues of our times. Brian Bloom has demonstrated an uncanny ability to predict world events, sometimes even before they are on the media radar. First he predicted the world financial crisis and its timing, then the increasing controversies regarding the causes of climate change. Next will be a dawning understanding that humanity must embrace radically new thought paradigms with regard to energy, or face extinction.
Via the medium of its lighthearted and entertaining storyline, Beyond Neanderthal highlights the common links between Christianity, Judaism, Islam, Hinduism and Taoism and draws attention to an alternative energy source known to the Ancients. How was this common knowledge lost? Have ego and testosterone befuddled our thought processes? The Muslim population is now approaching 1.6 billion across the planet. The clash of civilizations between Judeo-Christians and Muslims is heightening. Is there a peaceful way to diffuse this situation or will ego and testosterone get in the way of that too? Beyond Neanderthal makes the case for a possible way forward on both the energy and the clash of civilizations fronts.
Copies of Beyond Neanderthal may be ordered via www.beyondneanderthal.com or from Amazon
Copyright © 2009 Brian Bloom - All Rights Reserved
Disclaimer: The above is a matter of opinion provided for general information purposes only and is not intended as investment advice. Information and analysis above are derived from sources and utilising methods believed to be reliable, but we cannot accept responsibility for any losses you may incur as a result of this analysis. Individuals should consult with their personal financial advisors.
Brian Bloom Archive |
© 2005-2022 http://www.MarketOracle.co.uk - The Market Oracle is a FREE Daily Financial Markets Analysis & Forecasting online publication.