Free financial information from ADVFN - in depth information on company financial's and price charts
InvestorEducation /
Investing
Dec 06, 2006 - 11:39 AM GMT
By: Shahla_Walayat

ADVFN
 should be the lynch pin of every online trader's portfolio. UK traders are very well catered for, with real-time LSE quotes and charts, all for free. However, US traders can take advantage of the real time indices. Nasdaq and NYSE are also there.
After a simple registration on their site, the free services which ADVFN offer include real time quotes for stocks, real time monitors (which include bid/offer prices and the last price and volume of a share traded), share portfolios, alerts, charts, in depth company information , news and bulletin boards.
Two extremely impressive features are the portfolio and monitoring systems. Like most site portfolios, one is able to create a number of portfolios. However where ADVFN streaks ahead is the completeness of the portfolio tools. When entering a stock, you are able to include additional charges such as broker fees, commission and stamp duty. Bought the same share at many different prices? No problem, just input the share at all those different prices and when the summary is displayed, ADVFN has calculated the average cost spent per share after including all the additional charges at the different purchase prices.
The monitoring system is an extension of following a single real time quote. Instead, it is possible to track (numerically) the share prices in real time. With the monitoring system, you can set alerts to either your e-mail or to your mobile (with the help of an e-mail to sms service).
Using Google as an example of the extensive financial cover ADVFN provide in addition to news, quotes and charts -
| Company Name: | Google, Incorporated | | Ticker Symbol: | GOOG | 
|
| WWW Address: | www.google.com | | CEO: | Eric Schmidt | | No. of Employees: | 5,680 | | Common Issue Type: | CS | | Business Description: | A global technology leader focused on improving the ways people connect with information. The company maintains an online index of web sites and other content, and makes this information freely available to anyone with an Internet connection.
|
| | | Industry Information: | INTERNET - Internet Information Providers [more like this]
|
|
| Price | Day Change | Bid | Ask | Open | High | Low | Volume | | 487.5 |  0.5 0.5 | 487.52 | 487.6 | 486.5 | 489.44 | 484.89 | 881359 |
| Market Cap (mil) | Shares Outstanding (mil) | Beta | EPS | DPS | P/E | Yield | 52-Wks-Range |
| 149,098.5 | 306.2 | 0.78 | 5.02 | 0.00 | 62.0 | 0.0 | 513.00 - 331.55 |
|
| KEY FIGURES (Latest Twelve Months - LTM) | | Yesterday's Close | 487.00 | $ | | PE Ratio - LTM | 62.0 | |
| Market Capitalisation | 149,098.5 | mil |
| Latest Shares Outstanding | 306.2 | mil |
| Earnings pS (EPS) | 5.02 | $ |
| Dividend pS (DPS) | 0.00 | ¢ |
| Dividend Yield | 0.0 | % |
| Dividend Payout Ratio | 0 | % |
| Revenue per Employee | 1,080,732 | $ |
| Effective Tax Rate | 31.6 | % |
| Float | 305.2 | mil |
| Float as % of Shares Outstanding | 99.7 | % |
| Foreign Sales | 2,382 | mil |
| Domestic Sales | 3,757 | mil |
| Selling, General & Adm/tive (SG&A) as % of Revenue | 15.60 | % |
| Research & Devlopment (R&D) as % of Revenue | 10.70 | % |
| Gross Profit Margin | 65.2 | % |
| EBITDA Margin | 38.9 | % |
| Pre-Tax Profit Margin | 37.2 | % |
| Assets Turnover | 0.7 | % |
| Return on Assets (ROA) | 15.4 | % |
| Return on Equity (ROE) | 16.8 | % |
| Return on Capital Invested (ROCI) | 16.8 | % |
| Current Ratio | 9.8 | |
| Leverage Ratio (Assets/Equity) | 1.1 | |
| Interest Cover | 17506.8 | |
| Total Debt/Equity (Gearing Ratio) | 0.00 | |
| LT Debt/Total Capital | 0.0 | % |
| Working Capital pS | 34.76 | $ |
| Cash pS | 9.92 | $ |
| Book-Value pS | 47.03 | $ |
| Tangible Book-Value pS | 45.34 | $ |
| Cash Flow pS | 9.46 | $ |
| Free Cash Flow pS | 4.01 | $ |
 |
| KEY FIGURES (LTM): Price info |
| Price/Book Ratio | 10.36 | |
| Price/Tangible Book Ratio | 10.74 | |
| Price/Cash Flow | 51.5 | |
| Price/Free Cash Flow | 121.4 | |
| P/E as % of Industry Group | 120.0 | % |
| P/E as % of Sector Segment | 112.0 | % |
| | | Balance Sheet (at a glance) in Millions |
| | | | | | DIVIDEND INFO | | Type of Payment | - |
| Dividend Rate | 0.00 |
| Current Dividend Yield | 0.0 |
| 5-Y Average Dividend Yield | 0.0 |
| Payout Ratio | 0.0 |
| 5-Y Average Payout Ratio | 0.0 |
| |
| |
| |
| |
| |
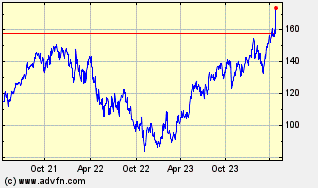
| | | | | Share price performance previous 3 years |
|
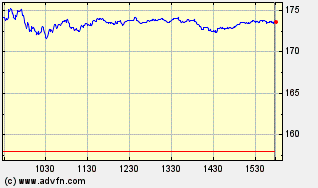
 | | | Share price performance intraday |
|
 | |
| |
| PRICE/VOLUME | High | Low | Close | % Price Chg | % Price Chg vs. Mkt. | Avg. Daily Vol | Total Vol |
| 1 Week | - | - | - | 1.3 | 100 | 55,245 | 88,429 |
| 4 Weeks | 513.00 | 474.14 | 473.55 | 2.8 | 100 | 56,114 | 897,825 |
| 13 Weeks | 513.00 | 377.77 | 377.85 | 28.9 | 118 | 62,823 | 3,832,217 |
| 26 Weeks | 513.00 | 363.36 | 386.57 | 26.0 | 112 | 57,588 | 7,140,913 |
| 52 Weeks | 513.00 | 331.55 | 409.20 | 19.0 | 106 | 85,326 | 21,160,853 |
| YTD | 513.00 | 331.55 | - | 17.4 | 104 | 85,115 | 19,916,996 |
| Moving Average | 5-Days | 10-Days | 10-Weeks | 30-Weeks | 200-Days | Beta (60-Mnth) | Beta (36-Mnth) |
| 484.42 | 491.90 | 456.94 | 412.20 | 405.60 | 0.78 | 0.85 |
|
| |
| GROWTH RATES | 5-Year
Growh | R² of 5-Year Growth | 3-Year
Growth |
| Revenue | 0.00 | 0.0 | 99.98 |
| Income | 0.00 | 0.0 | 157.45 |
| Dividend | 0.00 | 0.0 | 0.00 |
| Capital Spending | 0.00 | NA | 175.67 |
| R&D | 0.00 | NA | 128.82 |
| Normalized Inc. | 0.00 | NA | 110.52 |
| | | CHANGES | YTD vs.
Last YTD | Curr Qtr vs.
Qtr 1-Yr ago | Annual vs.
Last Annual |
| Revenue % | 75.4 | 70.4 | 92.5 |
| Earnings % | 87.2 | 92.4 | 267.2 |
| EPS % | 74.7 | 78.8 | 243.8 |
| EPS $ | 2.84 | 1.04 | 3.56 |
|
| |
| SOLVENCY RATIOS | | SHORT-TERM SOLVENCY RATIOS (LIQUIDITY) |
| Net Working Capital Ratio | 80.37 |
| Current Ratio | 12.1 |
| Quick Ratio (Acid Test) | 11.7 |
| Liquidity Ratio (Cash) | 10.78 |
| Receivables Turnover | 11.5 |
| Average Collection Period | 31 |
| Working Capital/Equity | 87.6 |
| Working Capital pS | 28.17 |
| Cash-Flow pS | 6.00 |
| Free Cash-Flow pS | 5.19 |
| FINANCIAL STRUCTURE RATIOS |
| Altman's Z-Score Ratio | 107.35 |
| Financial Leverage Ratio (Assets/Equity) | 1.1 |
| Debt Ratio | 8.3 |
| Total Debt/Equity (Gearing Ratio) | 0.00 |
| LT Debt/Equity | 0.00 |
| LT Debt/Capital Invested | 1.1 |
| LT Debt/Total Liabilities | 0.0 |
| Interest Cover | 0.0 |
| Interest/Capital Invested | 0.00 |
| | | | VALUATION RATIOS | | MULTIPLES |
| PQ Ratio | 5.21 |
| Tobin's Q Ratio | 14.52 |
| Current P/E Ratio - LTM | 62.00 |
| Enterprise Value (EV)/EBITDA | 59.11 |
| Enterprise Value (EV)/Free Cash Flow | 96.85 |
| Dividend Yield | 0.0 |
| Price/Tangible Book Ratio - LTM | 10.74 |
| Price/Book Ratio - LTM | 10.36 |
| Price/Cash Flow Ratio | 51.5 |
| Price/Free Cash Flow Ratio - LTM | 121.4 |
| Price/Sales Ratio | 16.00 |
| P/E Ratio (1 month ago) - LTM | 60.0 |
| P/E Ratio (26 weeks ago) - LTM | 68.1 |
| P/E Ratio (52 weeks ago) - LTM | 90.3 |
| 5-Y High P/E Ratio | 0.0 |
| 5-Y Low P/E Ratio | 0.0 |
| 5-Y Average P/E Ratio | 0.0 |
| Current P/E Ratio as % of 5-Y Average P/E | 0 |
| P/E as % of Industry Group | 120.0 |
| P/E as % of Sector Segment | 112.0 |
| Current 12 Month Normalized P/E Ratio - LTM | 59.8 |
| PER SHARE FIGURES |
| LT Debt pS | 0.00 |
| Current Liabilities pS | 2.54 |
| Tangible Book Value pS - LTM | 45.34 |
| Book Value pS - LTM | 47.03 |
| Capital Invested pS | 30.77 |
| Cash pS - LTM | 9.92 |
| Cash Flow pS - LTM | 9.46 |
| Free Cash Flow pS - LTM | 4.01 |
| Earnings pS (EPS) | 5.02 |
| | | | OPERATING RATIOS | | PROFITABILITY RATIOS |
| Free Cash Flow Margin | 24.76 |
| Free Cash Flow Margin 5YEAR AVG | 16.75 |
| Net Profit Margin | 23.9 |
| Net Profit Margin - 5YEAR AVRG. | 18.3 |
| Equity Productivity | 0.65 |
| Return on Equity (ROE) | 15.6 |
| Return on Equity (ROE) - 5YEAR AVRG. | 0.0 |
| Capital Invested Productivity | 0.65 |
| Return on Capital Invested (ROCI) | 15.6 |
| Return on Capital Invested (ROCI) - 5YEAR AVRG. | 0.0 |
| Assets Productivity | 0.90 |
| Return on Assets (ROA) | 14.3 |
| Return on Assets (ROA) - 5YEAR AVRG. | 0.0 |
| Gross Profit Margin | 65.2 |
| Gross Profit Margin - 5YEAR AVRG. | 0.0 |
| EBITDA Margin - LTM | 38.9 |
| EBIT Margin - LTM | 37.2 |
| Pre-Tax Profit Margin | 34.9 |
| Pre-Tax Profit Margin - 5YEAR AVRG. | 0.0 |
| Effective Tax Rate | 31.6 |
| Effective Tax Rate - 5YEAR AVRG. | 43.3 |
| EFFICIENCY RATIOS |
| Cash Conversion Cycle | 40 |
| Revenue per Employee | 1,080,732 |
| Net Income per Employee | 257,992 |
| Average Collection Period | 40 |
| Receivables Turnover | 11.5 |
| Day's Inventory Turnover Ratio | 0 |
| Inventory Turnover | 0.0 |
| Inventory/Sales | 0.0 |
| Accounts Payble/Sales | 1.88 |
| Assets/Revenue | 1.11 |
| Net Working Capital Turnover | 0.74 |
| Fixed Assets Turnover | 4.83 |
| Total Assets Turnover | 0.9 |
| Revenue per $ Cash | 1.58 |
| Revenue per $ Plant | 6.38 |
| Revenue per $ Common Equity | 0.65 |
| Revenue per $ Capital Invested | 0.65 |
| Selling, General & Adm/tive (SG&A) as % of Revenue | 15.9 |
| SG&A Expense as % of Revenue - 5YEAR AVRG. | 0.0 |
| Research & Devlopment (R&D) as % of Revenue | 7.9 |
| R&D Expense as % of Revenue - 5YEAR AVRG. | 7.9 |
|
| 
|
| |
 |
 |
© 2005-2022 http://www.MarketOracle.co.uk - The Market Oracle is a FREE Daily Financial Markets Analysis & Forecasting online publication.