


Stock Markets Succumb to Profit Taking
Stock-Markets / Financial Markets 2009 Nov 22, 2009 - 06:18 AM GMT

 Stock markets succumbed to a bout of profit-taking last week, sparked by concerns that the rally has overshot the pace of economic recovery. Riskier assets were showing signs of fatigue as the US dollar - the catalyst of many recent moves - stabilized and was perceived to be near its trough (if only short-term in the books of ardent dollar bears).
The greenback, usually the remit of the US Treasury, received support from Fed Chairman Ben Bernanke in a speech. He noted that the Fed was “attentive to the implications of changes in the value of the dollar and will continue to formulate policy to guard against risks to our dual mandate to foster both maximum employment and price stability. Our commitment to our dual objectives, together with the underlying strengths of the US economy, will help ensure that the dollar is strong and a source of global financial stability.” These comments spurred some buying interest.
Bill King (The King Report) summarized the situation as follows: “For the past few months, bad economic news was perceived to be good news for stocks on the rationale that it ensured more juice. Dollar down, stocks and gold up has been the routine. Are we at an inflection point, where bad economic news is becoming bad news for stocks?”
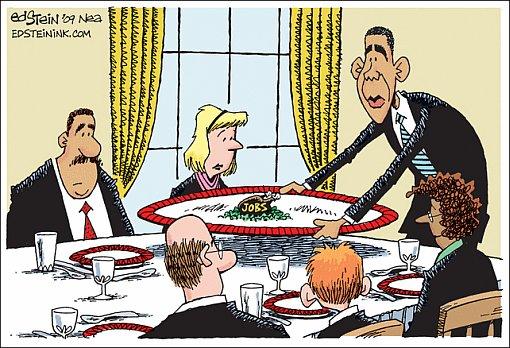
Source: Ed Stein, Comics.com, November 20, 2009.
The past week’s performance of the major asset classes is summarized by the chart below. With the exception of equities and investment-grade corporate bonds, most asset classes closed higher on the week despite nervousness creeping in before the weekend. Gold bullion touched a record high of $1,152.74 on Thursday and helped platinum, silver, palladium and copper reach fresh peaks for the year.
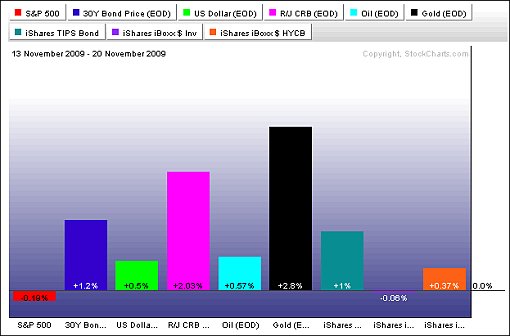
Source: StockCharts.com
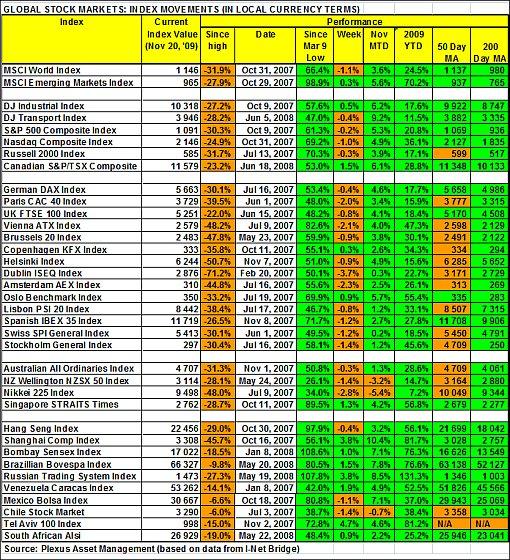
A summary of the movements of major global stock markets for the past week and various other measurement periods is given in the table below.
The MSCI World Index (-1.1%) and the MSCI Emerging Markets Index (+0.3%) followed different paths last week, resulting in year-to-date gains of 24.5% and an impressive 70.2% respectively. Notwithstanding solid gains since the March lows, no major index has yet been able to reclaim the 2007 pre-crisis peaks.
As far as the US indices are concerned, the Dow Jones Industrial Index eked out a small gain for the week as investors emphasized high quality, but the other major indices all reversed a two-week up-patch. Six of the ten economic sectors closed lower for the week, with Technology (-1.4%) and Consumer Discretionary (-1.1%) underperforming,
The year-to-date gains in the US remain firmly in positive territory and are as follows: Dow Jones Industrial Index 17.6%, S&P 500 Index 20.8%, Nasdaq Composite Index 36.1% and Russell 2000 Index 17.1%.
Click here or on the table below for a larger image.
Top performers among stock markets this week were Bangladesh (+21.3%), Latvia (+4.5%), Kazakhstan (+4.3%), Qatar (+4.1%) and China (+3.8%. At the bottom end of the performance rankings, countries included Ecuador (‑9.3%), Egypt (-7.6%), Greece (-7.1%), Turkey (-7.0%) and Macedonia (‑6.3%).
Of the 98 stock markets I keep on my radar screen, 39% recorded gains (last week 66%), 58% (31%) showed losses and 3% (3%) remained unchanged. (Click here to access a complete list of global stock market movements, as supplied by Emerginvest.)
While other benchmark indices have been going from strength to strength, the Japanese Nikkei Dow has been in a downtrend since August and last week recorded a fourth consecutive down-week. The weakness in Japanese stocks coincided with a surge in the price of credit default swaps (CDSs) on Japanese government bonds (JGBs) - under stress of sovereign solvency fears. The chart below shows the significant underperformance of the Nikkei (red line) versus the S&P 500 (green line) - in absolute terms in the top section and on a relative basis (blue line) in the bottom part.
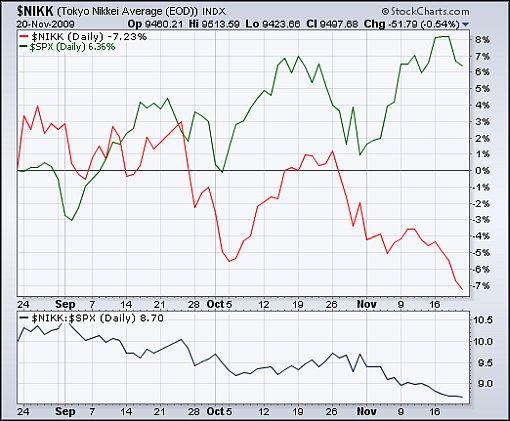
Source: StockCharts.com
John Nyaradi (Wall Street Sector Selector) reports that, as far as exchange-traded funds (ETFs) are concerned, the winners for the week included iShares Silver Trust (SLV) (+6.2%), PowerShares DB Silver (DBS) (+6.2%), PowerShares DB Base Metals (DBB) (+4.6%), SPDR S&P Metals and Mining (XME) (+3.8%) and Market Vectors Agribusiness (MOO) (+3.8%).
At the bottom end of the performance rankings, ETFs included iShares MSCI Turkey Investible Market (TUR) (-8.1%), HOLDRS Merrill Lynch Market Oil Service (OIH) (-4.3%), First Trust ISE-Revere Natural Gas (FCG) (-3.9%), SPDR S&P International Financial Sector (IPF) (-3.9%) and iShares Dow Jones US Home Construction (ITB) (-3.7%).
“Short-term US interest rates turned negative on Thursday as banks frantically stockpiled government securities in order to polish their balance sheets for the end of the year,” reported the Financial Times. Three-month T-Bills traded at a yield of -0.03% and six-month Bills fell to 0.12% - the lowest six-month yield since 1985. “Conventional wisdom says it’s year-end window dressing … But why Bills? If you want to park cash, why not place it in some short-term paper with a positive yield? … those pundits that exclaim there is no problem are not correct. If there were no concerns, the cash would not eagerly run to a negative yield vehicle,” observed Bill King.
Signs of heightened risk aversion also came from a widening of the spread of emerging-market bond yields over Treasuries and an increase in credit default swap spreads on corporate bonds and sovereign debt (notably the US and the UK). Risk aversion also resulted in the selling of some commodity-linked currencies.
In other news, a US congressional panel on Thursday approved the Ron Paul-Alan Grayson initiative to open the Federal Reserve’s monetary policy decisions to government audits. The panel approved the amendment to broader legislation to revamp financial rules, but put off a vote on the broader measure.
Also, the Fed announced a reduction in the term of discount window loans from 90 to 28 days, effective January 14, 2010. Asha Bangalore (Northern Trust) argued that the need for discount window loans had decreased significantly from the period following the collapse of Lehman Brothers. “This [Fed's announcement] marks the beginning of a gradual withdrawal of the extraordinary support the Fed has extended to the global financial system as signs of stability have emerged,” she said.
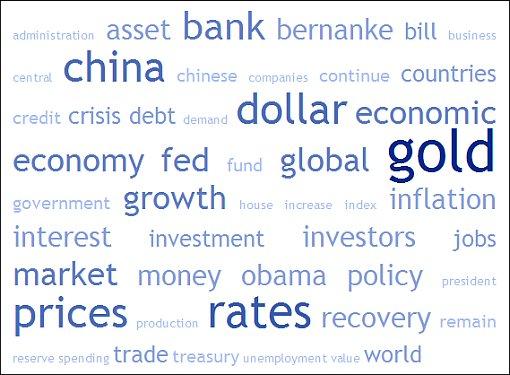
Next, a tag cloud of all the articles I read during the week. This is a way of visualizing word frequencies at a glance. “Gold” has been rising in prominence for a while, and now occupies the top slot in the media. Words such as “rates”, “dollar”, “prices” and “China” are not far behind.
Back to the stock markets: The S&P 500 Index broke above 1,100 on Monday, but reversed course later in the week and again closed below what was seen as an important resistance level.
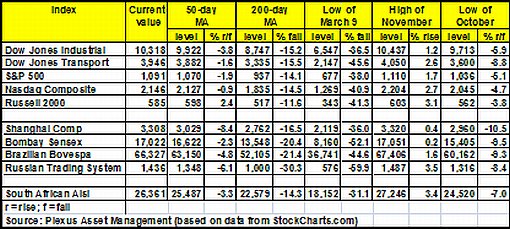
The major moving-average levels for the benchmark US indices, the BRIC countries and South Africa (where I am based in Cape Town) are given in the table below. With the exception of the Russell 2000 Index, the indices in the table are all trading above their 50-day moving averages, with all the indices also above their respective 200-day moving averages. However, many European markets have already fallen to below their 50-day lines (not shown on this table, but indicated on the performance table higher up), pointing to possible further weakness.
The October lows are also given in the table. A break below these levels would indicate a reversal of the uptrend since March, i.e. reversing the progression of higher-reaction lows.
In addition to having retraced 50% of their bear market declines and up-volume recently having been mediocre, the Dow Industrial and S&P 500 are up against significant medium-term downward trendlines. Also, negative divergences are showing up in a number of breadth indicators, often good leading indicators at tops, as discussed below.
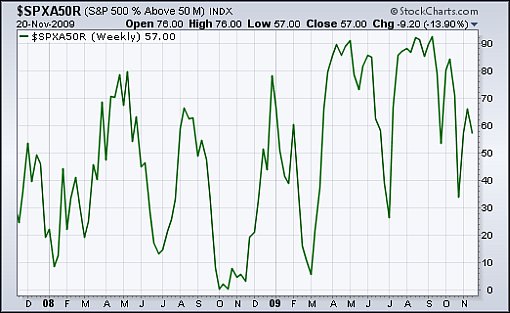
The number of S&P 500 stocks trading above their respective 50-day moving averages has declined from 92.6% in September to 56.8%, having made a series of declining tops while the underlying index was making new highs for the move. “This means that less and less stocks have been helping the index move higher, and it’s definitely something that favors the bearish argument,” said Bespoke.
Source: StockCharts.com
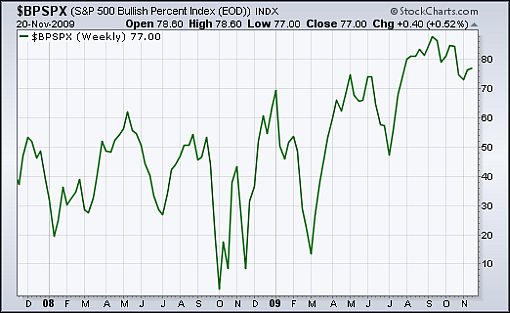
The Bullish Percent Index shows the percentage of stocks that are currently in bullish mode as a result of point-and-figure buy signals. The figure is still relatively high at 77.0%, but the indicator appears to be topping out.
Source: StockCharts.com
Richard Russell, 85-year-old writer of the Dow Theory Letters newsletter, said: “I keep thinking that the stock market is on thin ice … I’m still bothered by the fact that this ‘bull market’ never started from an area where stocks were selling below ‘known values’. Every bear market I’ve ever seen has ended with stocks selling below ‘known values’. We never saw anything like that at the October 2008 lows or at the March 2009 lows. For this reason, I continue to think that maybe the final bear market bottom lies ahead. Suspicion, thy name is Russell.”
In case you have missed Adam Hewison’s (INO.com) short technical analysis videos during the past week, click on the following links to access these excellent presentations: S&P 500, Dow and Nasdaq, the US dollar, gold and crude oil.
As stated before, share prices have moved too far ahead of economic reality. This calls for a cautious approach in anticipation of the market working off its overbought condition and fundamentals reasserting themselves. I will bide my time while the fundamentals play catch-up.
For more discussion on the economy and financial markets, see my recent posts “Velocity of US money supply at long last edging up“, “2009 Rally vs. 1982 Bull Market“, “Picture du Jour: Plunging dollar erodes non-US investors’ returns“, “WealthTrack: Bruce Berkowitz - golden rules of investing“, and “Donald Coxe - Investment Recommendations (November 2009)“. (And do make a point of listening to Donald Coxe’s webcast of November 20, which can be accessed from the sidebar of the Investment Postcards site.)
Economy
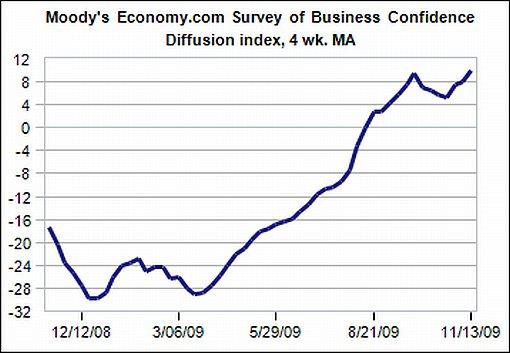
“Global business confidence is slowly improving. Businesses remain cautious, but sentiment is much better than at the beginning of the year and is consistent with a tentative global economic recovery,” according to the results of the latest Survey of Business Confidence of the World by Moody’s Economy.com. “Businesses were much more upbeat … notably optimistic about the economy’s prospects next spring. South American businesses are the most positive, and North Americans generally the most negative.”
Source: Moody’s Economy.com
The Ifo World Economic Climate Indicator rose in the fourth quarter of 2009 for the third time in succession, with the economic climate improving in all major economic regions. The improvement was particularly marked in Asia, where the indicator even surpassed its long-term average, but the climate indicator also rose clearly in Western Europe and North America in the fourth quarter. While the recovery of the world economy is driven especially by Brazil as well as India, China and other Asian countries, the economic expectations are now optimistic almost everywhere, with the exception of several countries in Central and Eastern Europe.
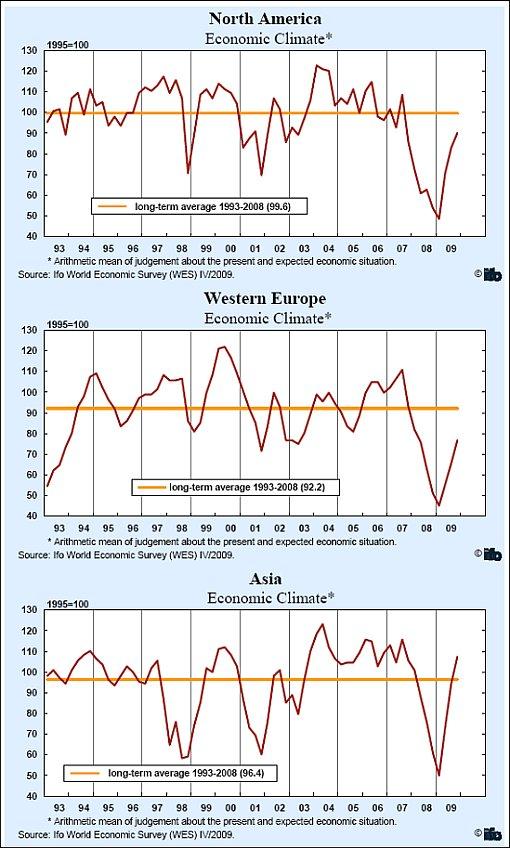
Source: Ifo, November 19, 2009.
The article continues here
By Dr Prieur du Plessis
Dr Prieur du Plessis is an investment professional with 25 years' experience in investment research and portfolio management.
More than 1200 of his articles on investment-related topics have been published in various regular newspaper, journal and Internet columns (including his blog, Investment Postcards from Cape Town : www.investmentpostcards.com ). He has also published a book, Financial Basics: Investment.
Prieur is chairman and principal shareholder of South African-based Plexus Asset Management , which he founded in 1995. The group conducts investment management, investment consulting, private equity and real estate activities in South Africa and other African countries.
Plexus is the South African partner of John Mauldin , Dallas-based author of the popular Thoughts from the Frontline newsletter, and also has an exclusive licensing agreement with California-based Research Affiliates for managing and distributing its enhanced Fundamental Index™ methodology in the Pan-African area.
Prieur is 53 years old and live with his wife, television producer and presenter Isabel Verwey, and two children in Cape Town , South Africa . His leisure activities include long-distance running, traveling, reading and motor-cycling.
Copyright © 2009 by Prieur du Plessis - All rights reserved.
Disclaimer: The above is a matter of opinion and is not intended as investment advice. Information and analysis above are derived from sources and utilizing methods believed reliable, but we cannot accept responsibility for any trading losses you may incur as a result of this analysis. Do your own due diligence.
Prieur du Plessis Archive |
© 2005-2022 http://www.MarketOracle.co.uk - The Market Oracle is a FREE Daily Financial Markets Analysis & Forecasting online publication.