


Energy and Precious Metals ETF Trading Report
Commodities / Commodities Trading Nov 19, 2009 - 03:16 AM GMTBy: Chris_Vermeulen

 So far this week has been generous with our commodity ETFs moving higher, other than natural gas which is clearly in a bear market. Each of the commodity ETF trading charts below is at a different stage and it will be interesting to see how things unfold in the coming weeks.
Trading ETFs is very rewarding when done properly and using multiple time frames for timing your entry and exit points is crucial. My main focus is on the weekly and daily charts but I use a 30 minute intraday chart when the time comes to actually pick an exact buy or sell point. Below I have provided both the weekly and daily chart so you can see how the same ETF looks completely different on the two time frames.
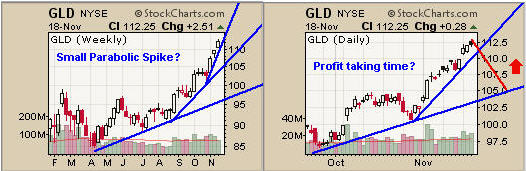
GLD ETF Trading – Weekly & Daily Trading Charts
The weekly chart a nice multi month rally but is now starting to go parabolic (straight up). When this happens I start tightening my stops so that I can lock in maximum gains. Now jump over to the daily chart and notice that gold has rallied longer than the previous move in early October. It looks overbought and ready for a pullback. Pullbacks on strong rallies like this tend to be hard and fast as stop orders get triggered sending prices tumbling down on heavy volume. My general thought is 5 days up in an investment is given back in 1 down day. This is why I scale out of positions when they are looking long in the tooth and ready for profit taking.
Gold ETF Trading Newsletter
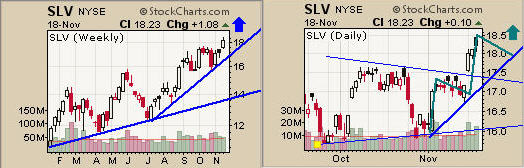
SLV ETF Trading – Weekly & Daily Trading Charts
Silver had been under performing gold for several weeks but made up some nice ground this week. Gold and silver tend to trade together so if gold pulls back I figure silver will also. That being said the weekly chart of silver looks ready to rocket higher for another week or so.
Silver ETF Trading Newsletter
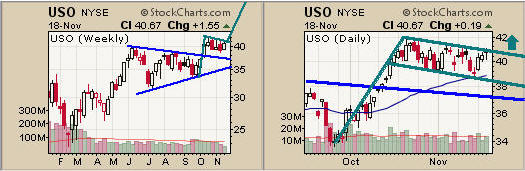
USO Fund Trading – Weekly & Daily Trading Charts
While gold and silver have been moving higher oil has been flagging sideways taking a breather. Both the weekly and the daily charts are aligned for a nice move higher if the trend and charts follow through on their patterns. We could get some tradable action in the next couple days.
Oil ETF Trading Newsletter
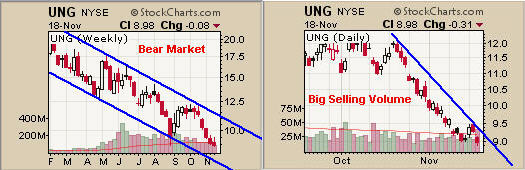
UNG Fund Trading – Weekly & Daily Trading Charts
Natural gas is really starting to slide. Wednesday UNG dipped below the Sept low of $8.94 by a couple cents then moved up into the close. Overall it’s not bullish. This could be the start of a waterfall sell off which is a sharp heavy volume sell off that lasts 3-5 days.
Natural Gas ETF Trading Newsletter
Commodity ETF Trading Conclusion:
To sum everything up the gold and silver ETFs are on fire as they continue to surge higher. Being ready for a sharp reversal is important if you want to lock in gains on a portion of your position.
Crude oil is taking its time but looking ripe for a breakout higher. We continue to watch for some action.
Natural gas continues to get pushed down and it’s not looking good for higher prices anytime soon. We are waiting for a shorting opportunity or an oversold condition to play a 1-5 day bounce.
Quick Trading Tip: If you have a position which has done well and has moved up for an extended period of time be sure to draw some trend lines and tighten your stop, or set a stop, under a tight trend line. Sell some of your position (25-50%) to lock in gains and let the core position continue to mature. If you get a pullback to a support level (previous breakout level) you can buy back your other part of your position at a lower price.
If you would like to receive my Free Weekly Trading Reports like this please visit my website: www.TheGoldAndOilGuy.com
To Your Financial Success,
By Chris Vermeulen
Chris@TheGoldAndOilGuy.com
Please visit my website for more information. http://www.TheGoldAndOilGuy.com
Chris Vermeulen is Founder of the popular trading site TheGoldAndOilGuy.com. There he shares his highly successful, low-risk trading method. For 6 years Chris has been a leader in teaching others to skillfully trade in gold, oil, and silver in both bull and bear markets. Subscribers to his service depend on Chris' uniquely consistent investment opportunities that carry exceptionally low risk and high return.
This article is intended solely for information purposes. The opinions are those of the author only. Please conduct further research and consult your financial advisor before making any investment/trading decision. No responsibility can be accepted for losses that may result as a consequence of trading on the basis of this analysis.
Chris Vermeulen Archive |
© 2005-2022 http://www.MarketOracle.co.uk - The Market Oracle is a FREE Daily Financial Markets Analysis & Forecasting online publication.