


Stock Market Negative RSI Divergence Problem
Stock-Markets / Technical Analysis Nov 18, 2009 - 11:33 AM GMTBy: Marty_Chenard

What is a Negative RSI Divergence and why should you care?
A Negative RSI Divergence is a condition where the underlying stock or index is moving higher, while the Relative Strength is moving lower.
So what is happening, is that each up move in the market is being made with less strength. Eventually, there is not enough strength to match the amount of an upward movement, and then the market or stock falls.
No one knows for sure exactly when "divergent strength" will hit is limit relative to a stock or index rising. But what one does know for sure, is that the "amount of risks" one is taking in a trade is increasing as that happens. Many hedge funds and money managers look for those kinds of market behaviors as a sign that they should reduce their exposure through hedging or start taking profits on part of their positions.
So, why discuss Negative RSI Divergences this morning?
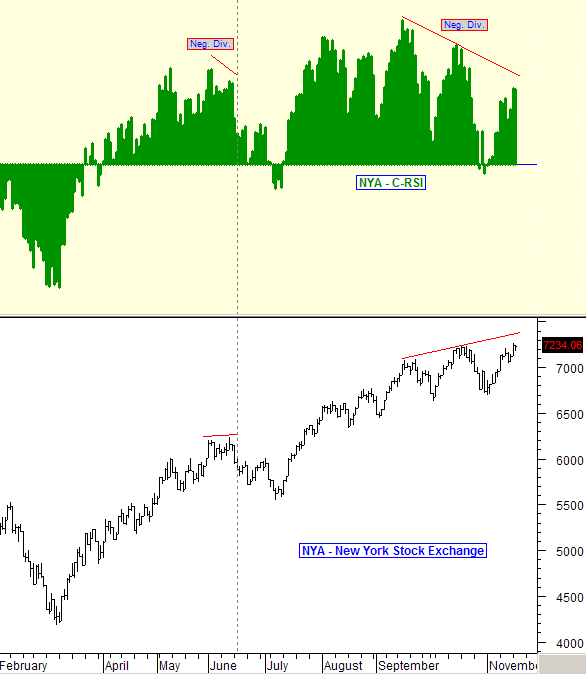
Because that is what is happening on the NYA Index and our Institutional "core holdings" index.
Take a minute and observe the chart below to see the Negative Divergence that is developing now. Unless this pattern changes soon, the negative divergence will become too large to sustain the market's desire to move higher.
(In our charts, we use a C-RSI which zero bases the Relative Strength so one can interpret it easily and quickly. An explanation of the C-RSI can be found at this link: C-RSI explained.)
** Feel free to share this page with others by using the "Send this Page to a Friend" link below.
By Marty Chenard
http://www.stocktiming.com/
Please Note: We do not issue Buy or Sell timing recommendations on these Free daily update pages . I hope you understand, that in fairness, our Buy/Sell recommendations and advanced market Models are only available to our paid subscribers on a password required basis. Membership information
Marty Chenard is the Author and Teacher of two Seminar Courses on "Advanced Technical Analysis Investing", Mr. Chenard has been investing for over 30 years. In 2001 when the NASDAQ dropped 24.5%, his personal investment performance for the year was a gain of 57.428%. He is an Advanced Stock Market Technical Analyst that has developed his own proprietary analytical tools. As a result, he was out of the market two weeks before the 1987 Crash in the most recent Bear Market he faxed his Members in March 2000 telling them all to SELL. He is an advanced technical analyst and not an investment advisor, nor a securities broker.
Marty Chenard Archive |
© 2005-2022 http://www.MarketOracle.co.uk - The Market Oracle is a FREE Daily Financial Markets Analysis & Forecasting online publication.