


SELL Signal Alerts For Stocks, Bonds, Gold and Crude Oil
Stock-Markets / Stocks Bear Market Nov 13, 2009 - 01:39 AM GMT

 U.S. equity benchmark indexes fell from 13-month highs as energy shares slumped following bigger- than-estimated growth in oil stockpiles, erasing an earlier advance spurred by Hewlett-Packard Co.’s takeover of 3Com Corp. The dollar rose the most versus the euro since August.
“The fundamentals just aren’t quite there yet,” said Sarah Hunt, a money manager who helps oversee about $6.5 billion for Purchase, New York-based Alpine Mutual Funds. “You still have a lot of concerns about the demand side of the equation for energy stocks. We’re getting a bit of a pause. Every time we get these big bursts of enthusiasm they tend to be tempered by the fact that the economy still looks pretty bad.” Sarah, its worse than you think.
FDIC decision coming soon.
On September 29th the FDIC announced a plan to bolster its reserves. There were three basic choices. A) Borrow from the Federal Financing Bank, B) Charge a large special assessment on the banks and C) Have the banks pre-pay three years of insurance premiums up front.
At the time, the FDIC gave the public a thirty-day comment period before the final determination. That time period is up. The letters are in. I would expect an announcement on this by Ms. Bair before the end of the week. Sheila appears to have chosen plan (C). However, plan (A) and (B) may also be used by the end of the year.
Market wrap, 1930 style: Stock price movements indicated relentless declines had finally produced an oversold condition. Heavy morning pressure on AT&T and Nat'l Biscuit normally “would have been extremely disturbing,” but only had a temporary unsettling effect. Strong rallying tendencies developed in the afternoon; short covering seen; specialties including Case and Auburn rose sharply, and US Steel led recovery in the major industrials, rebounding 5 points from recent low; upturn was checked in late afternoon by news of further slump in steel production, but efforts to renew decline were stubbornly opposed.
The VIX reverses from a new low.
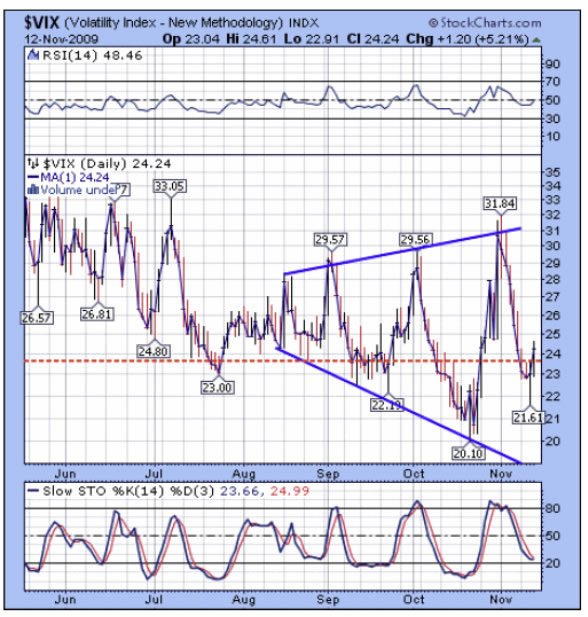
-- The VIX is finally above Critical Support/Resistance at 23.63. It still needs to put some distance between it and CS/R, but this is a good start.
Today is a pivot day for equities. I am not sure whether the pivot will be from a new high, or whether the market declines in wi, then closes the day in a wave 2pivot. Either one will work, but I am waiting for Today to see which way it will go.
Ah, but Today is Friday the 13th. Whose bad luck will it be?
SPY reversed below CS/R.
Action: Sell/Short/Inverse below 109.05
-- SPY reversed course and closed below Critical Support/Resistance at 109.05. What I would like to sis a reversal pattern in the daily chart by the end of Friday.
SPY appears to have made an impulse down, so we may expect a brief rally in the morning before it finally breaks down below CS/R. The other alternative may be a new high, but it appears to have met trend resistance in both the daily and the weekly models already, so I leave that thought as an alternate view.
QQQQ linger above CS/R.
Action: Sell/Short/Inverse below 43.43
--The QQQQs closed under their wedge formation but above Critical Support/Resistance at 43.43 today. Volume is picking up on negative action. That says a lot about this being a distribution market.
The Qs also finished an impulse down, so the same action will probably apply here. Once below 43.43, they will be on a sell signal. You may put in a stop above yesterday’s high if you wish, but I cassure you that the cycle is now pointing down hard.
XLF already has a daily reversal pattern.
Action: Sell/Short/Inverse
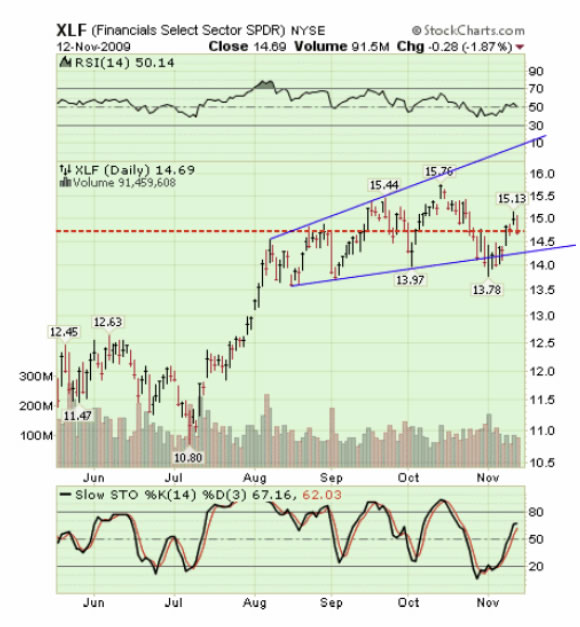
XLF appears to be ready for a hard decline down from here. It closed below Critical Support/Resistance at 14.71. The retracement of its prior decline is over and we can look forward to seeing strong progress to the downside. I haven’t formulated how the pivot may be working in the financials, but it appears that the pivot in XLF is the same as USO. That is, they precede the equities market by a day.
Cycles expand and contract, so we may use this assumption only as long as it works.
FXI slipped and fell.
Action: Sell/Short/Inverse
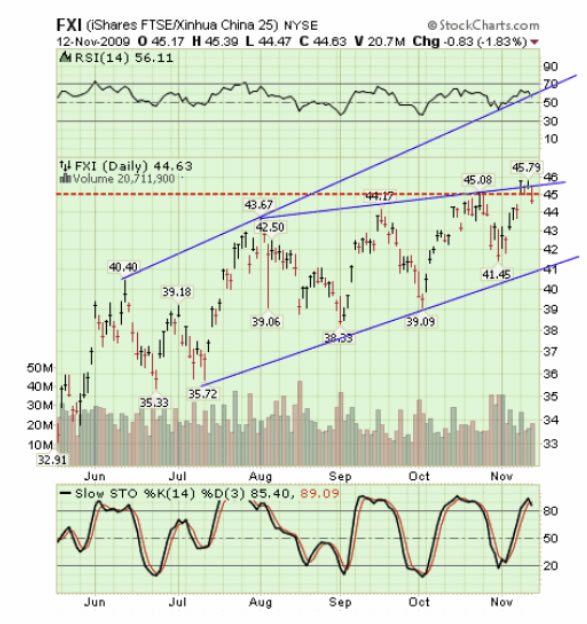
FXI hasn’t yet closed its gap yet, but it is below Critical Support/Resistance at 45.09 today.
This pattern has been “buying time” for longer than I would have expected. What appears to be happening is there may be a globally synchronized move in all the world markets, now that they are “in sync” with each other.
GLD is on a sell signal.
Action: Sell/Short/Inverse
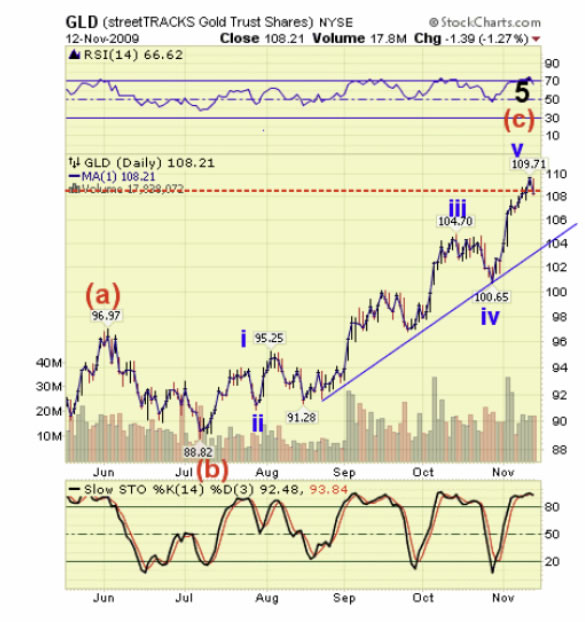
-- Although GLD’s pivot was on Monday, a person going short that day would likely be at breakeven today. It closed below Critical Support/Resistance at 108.42.
There is little doubt that there is a mania in gold, as per this article. Please take it with a grain of salt. The patterns say that gold is done going up for a good season (or maybe two).
USO regained its resolve to decline.
Action: Sell/Short/Inverse
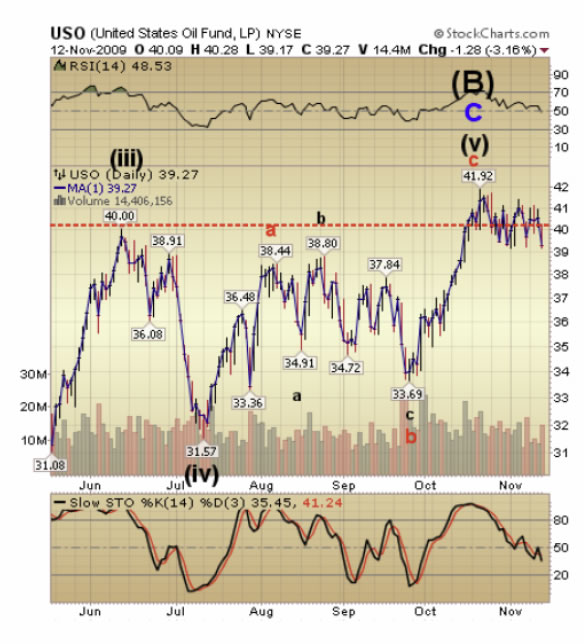
-- USO found its resolve to get out of Dodge and closed below Critical Support/Resistance at 40.14. There is no support under this formation until USO hits 33.00. However, Model Support is below that at the July lows before this decline is over.
There may be bumps along the way, but I’d be “all in” on the short side in oil.
TLT pivots out of its head and shoulders.
Action: Sell/Short/Inverse
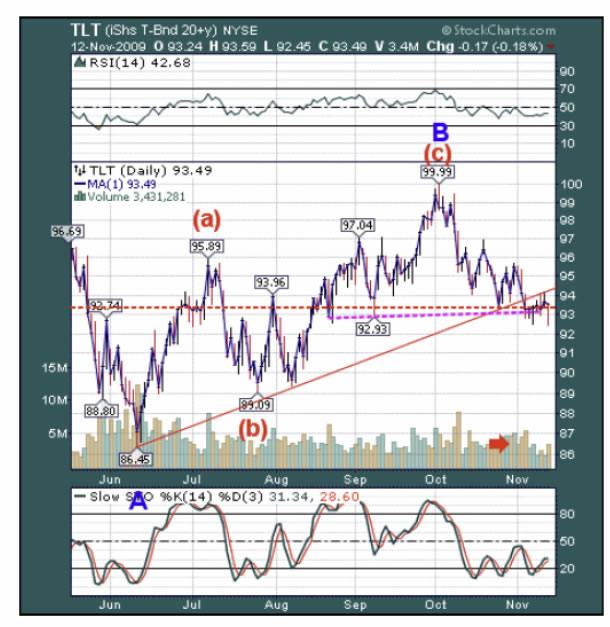
--TLT pivoted off trend support just below Critical Support/Resistance at 93.46 and its “neckline” today.
I put the word neckline in quotes, since it now appears to be abandoning that formation for a higher aspiration. Head and shoulder patterns do fail, as we well know about the one in SPY in July.
I will have to revise my wave pattern as soon as we get confirmation of a reversal pattern or a rally back above its diagonal trendline.
UUP makes a commotion and starts to act impulsively.
Action: Buy/Long
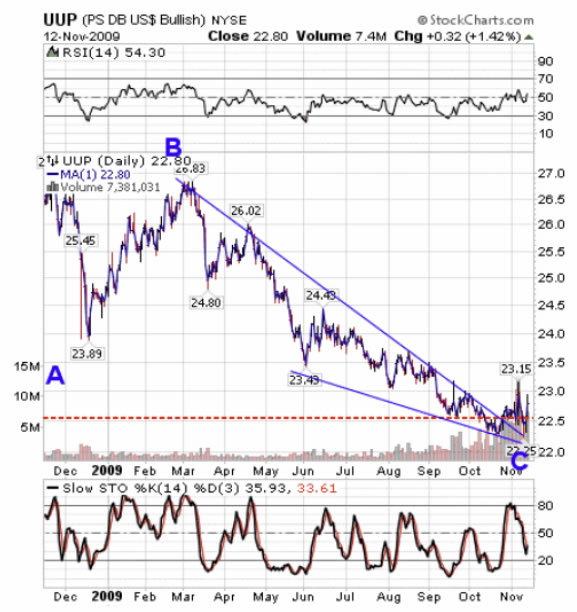
-- UUP did a lot of backing and filling, but finally looked impulsive at the end of the day. It closed above Critical Support/Resistance at 22.60. It may have a small setback to 22.50 or higher today, but it appears to be finally in charge of its (upward) destiny.
We got our wish with the explosive move and now need to see some follow-through above 23.15.
Have a great day!
Tony
Our Investment Advisor Registration is on the Web
We are in the process of updating our website at www.thepracticalinvestor.com to have more information on our services. Log on and click on Advisor Registration to get more details.
If you are a client or wish to become one, please make an appointment to discuss our investment strategies by calling Connie or Tony at (517) 699-1554, ext 10 or 11. Or e-mail us at tpi@thepracticalinvestor.com .
Anthony M. Cherniawski,
President and CIO
http://www.thepracticalinvestor.com
As a State Registered Investment Advisor, The Practical Investor (TPI) manages private client investment portfolios using a proprietary investment strategy created by Chief Investment Officer Tony Cherniawski. Throughout 2000-01, when many investors felt the pain of double digit market losses, TPI successfully navigated the choppy investment waters, creating a profit for our private investment clients. With a focus on preserving assets and capitalizing on opportunities, TPI clients benefited greatly from the TPI strategies, allowing them to stay on track with their life goals
Disclaimer: The content in this article is written for educational and informational purposes only. There is no offer or recommendation to buy or sell any security and no information contained here should be interpreted or construed as investment advice. Do you own due diligence as the information in this article is the opinion of Anthony M. Cherniawski and subject to change without notice.
Anthony M. Cherniawski Archive |
© 2005-2022 http://www.MarketOracle.co.uk - The Market Oracle is a FREE Daily Financial Markets Analysis & Forecasting online publication.