Long Term Equity Valuation, Replacing the P/E Ratio for DR3
Stock-Markets / Stock Market Valuations Nov 02, 2009 - 05:40 PM GMTBy: Francois_Soto
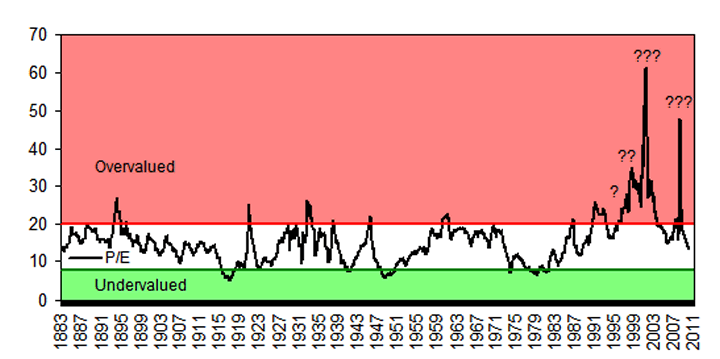
 Is the S&P 500 undervalued from the current level? To answer this question, one might be tempted to look at the actual P/E (Price / Earnings) and establish a comparison with its historical data. You most likely have seen this chart before:

Source: Bloomberg, EMphase Finance.
The chart above is using operating earnings for the P/E calculation. Standard & Poors publishes two earnings formats: operating earnings and reported earnings. Operating excludes write-off charges while reported includes them. In other words, operating earnings are higher and reported earnings are lower.
P/E Advantages
- The most popular valuation metric due to its ease of calculation.
- Using earnings as denominator, a known determinant of investment value.
P/E Shortcomings
- Earnings can be negative or very low which makes the P/E meaningless.
- Volatility of earnings can make it hard to interpret.
- Accounting measures distort earnings as seen in corporate scandals.
- No consensus regarding the use of operating or reported earnings.
- It displays mean reverting properties but is unbounded as of 1999.
Proposed Solution
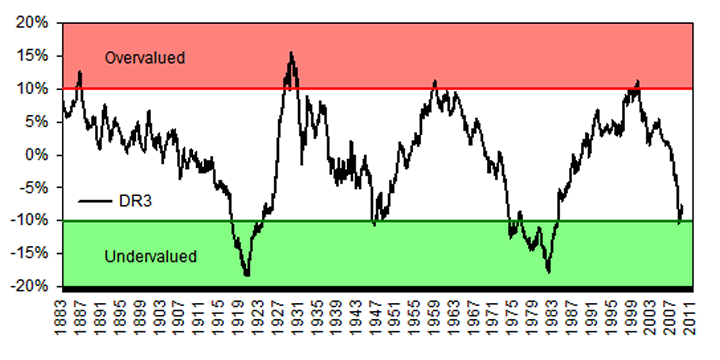
Is there a better metric for long term equity valuation than the P/E? Yes, the Dynamic Real Required Return – DR3. The result is displayed on this chart:

Source: Bloomberg, EMphase Finance
Definition
The DR3 is simply the real risk-free rate + real expected market risk premium.

DR3 vs. CAPM
You probably recognized a part of this equation and said: Hey, you just wrote the CAPM equation! Yes, but there are two major differences: 1) CAPM is keeping the parameters static (except beta) while the DR3 is making them dynamic. 2) CAPM is using nominal returns while the DR3 is using real returns.
DR3 = Dynamic Real Required Return.
β = Beta is equal to 1 because we are valuing the S&P 500. In this case, it can be removed from the equation without a problem.
Infl = Inflation using the CPI All Items. It is estimated with a trailing CAGR (Compound Annual Growth Rate) over the last ten years.
E(Rm) = Expected return on S&P 500. It is estimated with a trailing CAGR (Compound Annual Growth Rate) over the last ten years.
Rf = Risk-free rate using the US Government 10-Year yield. It is estimated with a moving average over the last ten years.
DR3 Advantages
- Easy to calculate given the few inputs required.
- Relates to ROE from an investor’s perspective.
- Can be positive and negative without any problem.
- Can be scalable to adjust time horizon / volatility.
- Limited distortion except maybe CPI by the US government.
- Well bounded with great mean reverting properties.
DR3 Shortcomings
- Harder to derive a price target. More research is required.
Interpretation
When investors are greedy and require too much real return on equity (more than ten percent), this signals markets are overvalued. It does not mean the markets will collapse right away, although it might be the case as seen in 1929 and 2000. The DR3 should be used in conjunction with other indicators.
When investors are fearful and think the real return on equity is going to be grim (less than ten percent), this signals markets are undervalued. In theory, no rational investor would invest when expected real return on equity is declining and negative but they still do. Market participants are risk seeking and irrational.
When the DR3 goes from overvalued to neutral, equities should underperform treasury bills or bonds or gold. When the DR3 goes from undervalued to neutral, equities should outperform treasury bills or bonds or gold. Further analysis is required to learn more about the other properties of the DR3.
The DR3 barely touched the undervalued level in March 2009 and is now increasing slightly since then. Historically, the DR3 previously reached readings as low as -17% twice. Consequently, it is not impossible to see further declines in the future and reach valuation levels that will be more attractive.
By Francois Soto, President
EMphase Finance
www.emfin.com
© 2009 EMphase Finance. All rights reserved.
EMphase Finance strives to become one of the most important website in North America concerning fundamental analysis using traditionnal quantitative and technical analysis based on the Elliott Wave Principle. The website will contain detailed analysises concerning specific companies, commodities and indexes along with educational content.
© 2005-2022 http://www.MarketOracle.co.uk - The Market Oracle is a FREE Daily Financial Markets Analysis & Forecasting online publication.


