


Where's Crude Oil Going Next? Boom or Bust
Commodities / Crude Oil Oct 17, 2009 - 05:10 PM GMT

 Everyone's been complaining about the cost of living as the economic crunch really takes hold. Money's getting tighter, everything's getting more expensive and the government's "inflation" numbers don't seem to be totally accurate or honest.
But fortunately for our pocketbooks, oil hasn't yet gone on the sort of giddy rise we've seen in the stock market (and gold too, for that matter).
Oil is nowhere near to making a new high, as you can see by the weekly chart below. Instead it's stabilized at $70, right around its long and short moving averages.
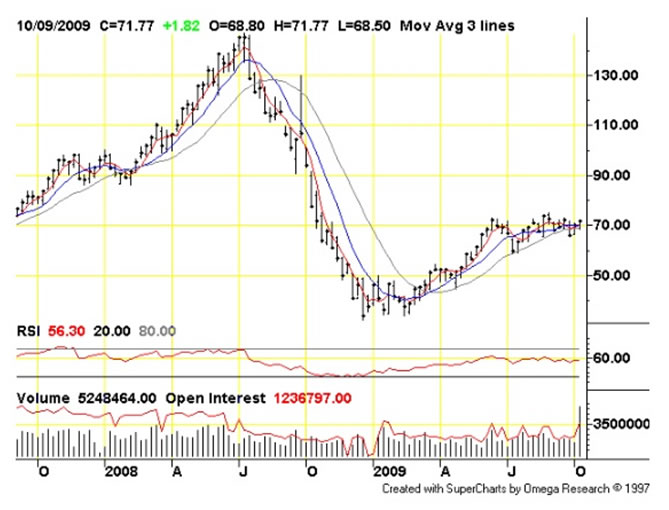
Like all prices these days, we can bet on one thing: it won't stay stable for long. From here, oil could rebound spectacularly and threaten to return to its old highs around $130 -- or it could collapse to well below $50 again.
So which way is it going to go?
No one can say for sure because none of us have a totally accurate crystal ball – but let's examine a bit more data to help us make a decision.
The Case For An Oil Bull Or Bear
What could drive the price of oil itself? As the world's most heavily traded (and therefore politicized) commodity, there are probably a near-infinite number of factors in play.
However, they all break down to supply and demand.
On the bullish side, some parties feel optimistic that a true economic recovery is in the works and therefore we'll see a rise in energy demand and oil prices. China's demand for oil seems relentless, by way of example.
There's also the peak oil argument (dwindling supply) and the never-ending political tension in the Middle East too.
On the bearish side, there are reports of oil surpluses and over-supply and the economic recovery doesn't really seem to be shaping up the way the cheerleaders are claiming.
A further ingredient in the mix is the fact that oil is priced in U.S. dollars. If the dollar weakens further, oil will rise to reflect that weakness. But if the dollar shows strength when measured against other paper currencies, we'll see more of a flatline in the oil price despite other bullish factors (which has in fact happened).
As we stated in this column two weeks ago, the 'death of the dollar' is overdone at this time. Everyone's a bit too eager to dance on the dollar's grave right now, which means it will probably surprise the herd (yet again) and hold up in the face of adversity.
So what does this mean for oil? Well, let's look at the performance of the major oil companies as to where the price might go...
Are Oil Companies Leading Indicators Or False Beacons?
Oil itself has flatlined for now, but as we can see, the price of a basket of oil companies as been anything but flat.
The CBOE Oil index (OIX) is a price-weighted index composed of 15 large and widely-held integrated oil companies. The largest four components are APA (Apache), OXY (Occidental Petroleum), XOM (ExxonMobil) and CVX (ChevronTexaco).
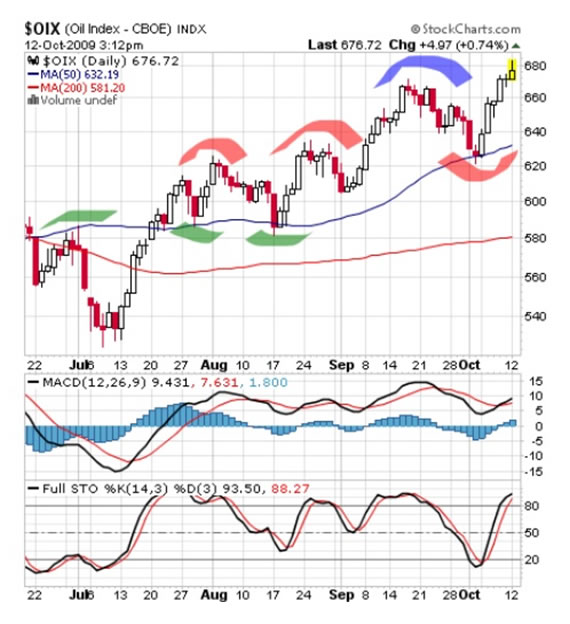
The OIX has been in a definite uptrend lately – it's rebounded strongly every time it's touched its 50 day moving average (the blue line).
It appears to be temporarily overbought if we go by the stochastics indicator.
But at the same time its uptrend has been confirmed by the repeated fact that previous resistance has become support. Look at the 580-600 area (green), the 620-630 area (red) and now the 660-670 area (blue).
If the uptrend is still intact, we have two possible areas of support:
a) That 660-670 area where resistance could provide support, and
b) The 50 day moving average which will probably make it to 640 level by the time the price retraces
The safest place to buy the OIX is b), but a more aggressive trader could try buying at a) with a tight stop.
Of course, neither of these ideas will work if the OIX uptrend is well and truly over. That's the risk we take as traders and investors.
N.B. If you think the OIX bull market is over, selling now is probably the way to go as the stochastics indicator is showing a very high level and that's often proven to be a low-risk shorting point.
Equity Plays on Oil Price Volatility
There are several ways you can play the oil market without actually trading oil futures or the OIX index itself.
You could buy (or short) any of the constituent companies in the OIX itself such as APA (Apache), OXY (Occidental Petroleum), XOM (ExxonMobil) and CVX (ChevronTexaco).
Here's a comparison of these four most heavily-weighted stocks from the OIX:
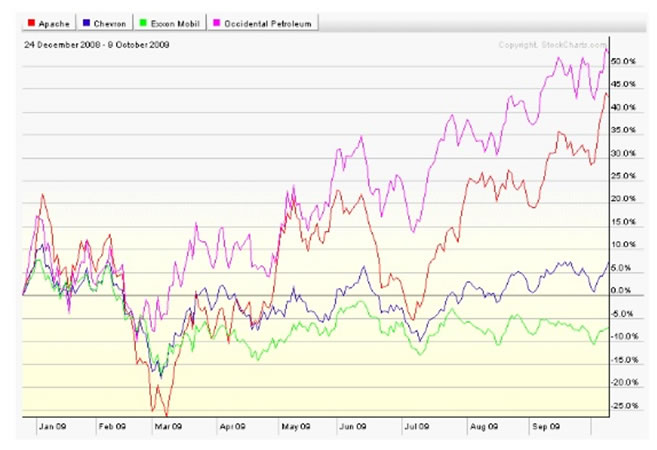
There's a very strong variation in performance here, and it seems that OXY is clearly the strongest stock of the bunch with only Apache demonstrating any real rivalry here.
So if you don't like the idea of investing in (or shorting) stocks directly due to company-specific factors that could cause unpleasant surprises, there are now some ETFs (Exchange Traded Funds) available.
Some are neutral, some are biased toward the long side, and some are biased toward the short side. You can just pick a fund that reflects your views on oil...
1. Goldman Sachs Crude Oil Total Return ETN (OIL)
2. MacroShares Oil Down ETF (DOY)
3. MacroShares Oil Up ETF (UOY)
4. PowerShares DB Crude Oil Double Long ETN (DXO)
5. PowerShares DB Crude Oil Double Short ETN (DTO)
6. PowerShares DB Crude Oil Long ETN (OLO)
7. PowerShares DB Crude Oil Short ETN (SZO)
8. PowerShares DB Oil Fund (DBO)
9. ProShares Ultra DJ-AIG Crude Oil ETF (UCO)
10. ProShares UltraShort DJ-AIG Crude Oil ETF (SCO)
11. United States 12 Month Oil Fund (USL)
12. United States Heating Oil Fund (UHN)
13. United States Oil Fund (USO)
Some of these are so new they don't have charts of any practical use yet.
But here's a comparison of three relatively neutral oil ETFs (red is OLO, green is USO, blue is OIL if that's not clear from the key on the chart) to help you make a choice:
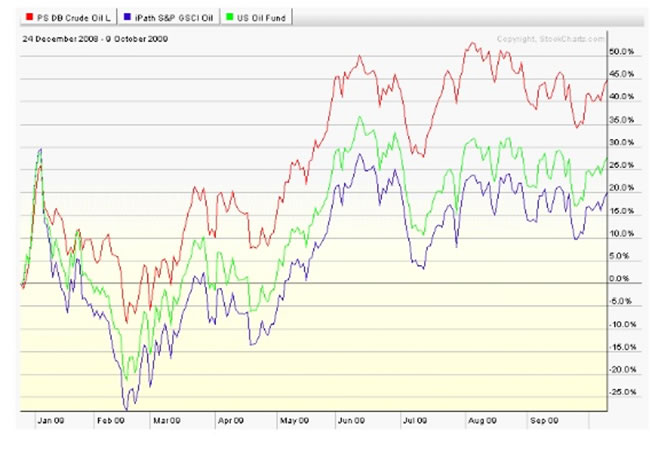
OLO is clearly the best performer of the bunch here. But the choice is up to you.
Good investing,
Nick Thomas
Analyst, Oxbury Research
Nick Thomas is a seasoned veteran of technical analysis and has mastered all intra-day trading in stocks, options, futures and forex. He prefers to scout investments as one asset class of many and shapes his investment strategies accordingly. He writes extensively about offshore banking and offshore tax havens and is active in the career development field of independent investment research.
Oxbury Research originally formed as an underground investment club, Oxbury Publishing is comprised of a wide variety of Wall Street professionals - from equity analysts to futures floor traders – all independent thinkers and all capital market veterans.
© 2009 Copyright Oxbury Research - All Rights Reserved
Disclaimer: The above is a matter of opinion provided for general information purposes only and is not intended as investment advice. Information and analysis above are derived from sources and utilising methods believed to be reliable, but we cannot accept responsibility for any losses you may incur as a result of this analysis. Individuals should consult with their personal financial advisors.
Oxbury Research Archive |
© 2005-2022 http://www.MarketOracle.co.uk - The Market Oracle is a FREE Daily Financial Markets Analysis & Forecasting online publication.