


Stock Market Cycle Turning Points Analysis 1st July 2007
Stock-Markets / Cycles Analysis Jul 01, 2007 - 04:17 PM GMTBy: Andre_Gratian

Current Position of the Market.
SPX: Long-Term Trend - The 12-year cycle is still in its up-phase but, as we approach its mid-point some of its dominant components are topping and could lead to a severe correction over the next few months.
SPX: Intermediate Trend - Intermediate cycles are causing a consolidation/correction in the uptrend which could last a few more weeks.
Analysis of the short-term trend is done on a daily basis with the help of hourly charts. It is an important adjunct to the analysis of daily and weekly charts which determines the course of longer market trends.
Daily market analysis of the short term trend is reserved for subscribers. If you would like to sign up for a FREE 4-week trial period of daily comments, please let me know at ajg@cybertrails.com .
Over the past month, large cap indices have established a consolidation pattern consisting -- so far
-- of a double top and a double bottom. For the SPX, this represents about a 55 point range whose
low was successfully tested last week in conjunction with the bottoming of a short-term cycle. This
caused a rebound into Friday where it met, once again with selling about half way through its range.
The Russell 2000 pattern is slightly weaker with a series of descending tops, and the Nasdaq slightly
stronger.
Intermediate term cycles which are due to make their lows over the next few weeks are responsible for temporarily arresting the uptrend. They are not expected to bring about much weakness, but by the time they bottom, the trading range of the SPX should be broken to the downside.
One sector which is pressuring the market is the banking sector. The subprime mortgage fiasco
which is unfolding is creating a negative chart pattern for this index, and one could even argue that
it established a long-term top in February. I say unfolding, because some believe that it will get
much worse and, according to John Mauldin, may reach losses of $250 billion. But, with the Fed
assuring us that this weakness will not spread to the rest of the economy, and the belief that if it
does, the Fed will come to the rescue, the market does not seem to be overly concerned at this time.
Part of the reason is that the psychological climate is not ripe for investors to worry about this or any
other problem. It could be different by year end and going into next year, as longer term cycles roll
over.
The influence of the BKX is primarily on the SPX, and this is one of the reasons why the Nasdaq is stronger technically. The latter is being helped by a recent rash of excellent earnings reports by tech stocks. On Friday, the NDX came very close to its former high, and although it has slowed its rise during this consolidation, it is still making a pattern of higher highs and higher lows.
Last week, I mentioned that crude oil was on the rise again and that the Point & Figure chart
suggested that the continuous contract could see $75 before long. Last week it rose to $71 and still
looks higher. But while its rise in price had a psychological impact when it first reached $80 a year
ago, little seems to be made of it this time around -- and probably for the same reason as that given
above.
What’s Ahead?
Momentum:
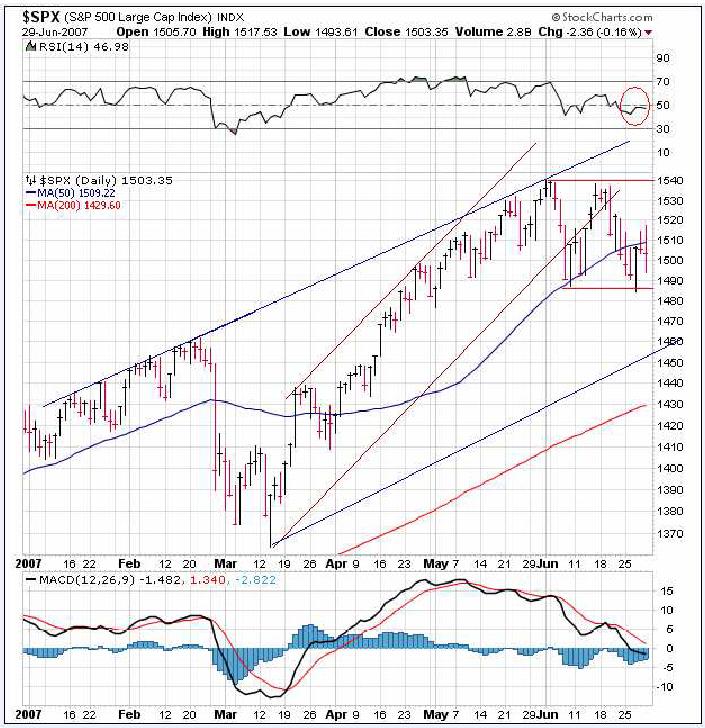
We'll continue to examine the same SPX chart (courtesy of StockCharts) in order to give a continuity
to our analysis.
I have drawn some channels to identify the various trends. The up-trending red channel was broken when the index began its consolidation. The broader blue channel may represent the current trend. If this is so, the index will eventually find the bottom trend line or go slightly beyond by the time it makes its low.
The MACD (at the bottom) has gone from a very overbought condition to slightly negative. At this time, it does not look quite ready to turn back up. The other momentum indicator at the top is the RSI. You can see that it has stabilized at a neutral reading. I would expect it to become more oversold before the consolidation ends.
The first decline was arrested by the 50 DMA , but the index is now trading below it. This is causing the MA to slow its rise and potentially begin to roll over. The 200 DMA is still far below and not threatened in any way.
The overall chart pattern suggests that more consolidation is needed, which is consistent with the current cycle outlook.
Cycles
A short-term cycle which made its low on 6/27 caused the short-term decline into that time frame. It
was also the cause of the rebound which took place over the next two days. Friday's action was
more erratic and volatile than normal because of the end-of-quarter activity, but it looks as if the rally
came to an end for the SPX at 1517 in the first hour of trading on Friday.
This is what a subsequent decline of 23 points for the rest of the day suggests. I suppose that you could blame it on volatility, but it looks a little excessive. Since the 2.5-week cycle is due to make its low right around 7/4, it could be the cause of the retracement and it could also bottom early. The first few days of July are historically bullish.
Two more short-term cycles, the 6-week and 20-day, are scheduled to bottom early the following week so near-term, there are more reasons for the market to go down than up.
The 20-week cycle should ideally keep the market under pressure until about the 4th week in July.
This cycle on its own does not always produce much of an impact. But this also represents the 80-
wk cycle low, and it will be further reinforced by the bottoming of the 4.5-yr cycle. The only question
is whether the 4.5-yr will make its low exactly at the same time or a little later. Some see a low in
mid-August. We'll just have to let the market tell us.
If all these cycles arrive at the prescribed time, it would be difficult for the market to muster any kind of an uptrend before the end of July, at the earliest. But remember that what comes down also goes up, afterwards! This is when it will get interesting because even longer cycles will be in a position to turn down by then, and they may not exert enough influence on the market to keep it from making a new high.
Projections
From the last newsletter:
From the lows made last week, we can establish confirming counts and Fibonacci projections both to 1538
and to 1560. 1538 was reached on Friday and stopped the advance. We'll see next week if it's only
temporary or longer lasting.
The 1538 projection did establish the peak of the rally from 6/08. The Morning Comment this past Thursday stated the following:
Yesterday's close was right at a resistance point and this may cause a pause in the rally. The market may also want to wait for the Fed decision which is due later on today. Over the next few days, the SPX should continue to trend higher. Another pause at 1510-11 is likely, and then 1516-17. After that level is reached, we'll reassess the short-term trend to see if it is beginning to form a topping pattern which will mark the end of the rally.
The Fed decision, which was received favorably by the market, took the SPX a little past 1511 and
the next day it reached the second projection at 1517. As discussed above, this looks like an
important enough reversal to put a short-term top in place. The only thing that bothers me is that the
advance/decline managed to remain in its short-term uptrend. It could mean additional distribution
will be needed before the SPX can head lower.
Concerning projections for the intermediate-term low, I have nothing solid at this point. 1464 seems reasonable if we can make a decisive penetration of the 1488 level. The first attempt was stopped at 1485 on 6/27. It if is challenged again in the next two weeks, it should be penetrated this time.
Breadth
This is where the relative strength of the Nasdaq to the SPX shows up very clearly. While the NYSE
summation index is plunging, the Nasdaq index has gone into a sideways pattern. The reason for
this dichotomy was discussed above. With the cycles that lie ahead, it will be interesting to see how
this disparity resolves itself.
Market leaders & Sentiment
Remember this chart which I posted last time? This is the updated version:
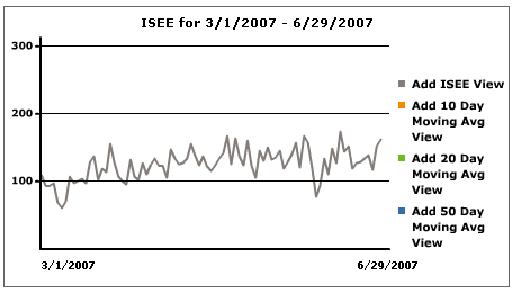
On Friday, its reading reached 197, which prompted me to issue this update:
----- Original Message -----
From: Andre Gratian
Sent: Friday, June 29, 2007 10:43 AM
Update
Be very cautious here! The ISEE (put/call indicator) that I mentioned in a former report is flashing its most negative
signal in MONTHS. It may be a little early, but this does not look good for the market here. With this signal, it's entirely
possible that we may have seen the high of the rally this morning. I have not followed it closely enough to know if there is
a lead time to this indicator and how much, but I don't think it's that much.
Andre
At the time, the SPX was trading at 1514. Less than 2 hours later it made a low or 1494 (a good example of the advantage of receiving intra-day updates in this volatile market environment). By the close on Friday, the index had come down to 161. Nevertheless, this is still a relatively high reading and suggests that more selling probably lies ahead.
Summary
Written in the last newsletter: All signs are pointing to an imminent intermediate market top which should
bring about a decline of 5 to 8 weeks. This top could come as early as next week. Looks like it came right
on time! Longer term cycles suggest that the low is still at least 4 to 6 weeks away.
I must point out, however, that some Elliott Wave technicians believe that the low may already have been made and that the SPX may be ready to move to new highs right away.
By Andre Gratian
MarketTurningPoints.com
If this information is of value to you, you should consider our trial subscription offer (above). Daily updates consist of a Morning Comment, Closing Comment (which occasionally includes an updated hourly chart of the SPX to illustrate the analysis), and at least one or more updates during the trading session whenever it is warranted by market action. These updates discuss phase completions, give projections, potential reversal points, and whatever else may be pertinent to the short-term trend.
“By the Law of Periodical Repetition, everything which has happened once must happen again, and again,
and again -- and not capriciously, but at regular periods, and each thing in its own period, not another’s, and
each obeying its own law … The same Nature which delights in periodical repetition in the sky is the Nature
which orders the affairs of the earth. Let us not underrate the value of that hint.” -- Mark Twain
You may also want to visit the Market Turning Points website to familiarize yourself with my philosophy and strategy.www.marketurningpoints.com
Andre Gratian Archive |
© 2005-2022 http://www.MarketOracle.co.uk - The Market Oracle is a FREE Daily Financial Markets Analysis & Forecasting online publication.