


Are Institutional Investors Selling or Buying Stocks?
Stock-Markets / Stock Market Sentiment Oct 14, 2009 - 01:36 AM GMTBy: Marty_Chenard

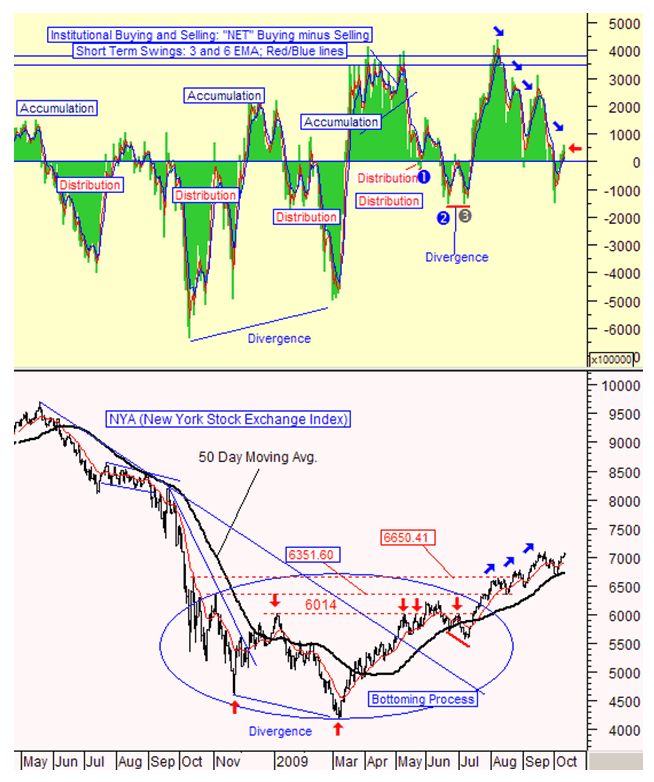
Are Institutional Investors taking profits?
Today's study shows the "net" daily amount of daily Buying and Selling for Institutional Investors. The green bars show the daily net calculation by subtracting the amount of Selling from the amount of Buying.
If the net is positive (more buying than selling), then Institutions are in Accumulation. If the net is negative (more selling than buying) then Institutions are in Distribution. Professional investors never go "against" what the Institutional Investors are doing because Institutions control over 50% of the daily volume in the stock market.
So, are Institutional Investors in Accumulation or Distribution now?
The answer is that they are currently in Accumulation.
Is the current Accumulation trending up or down?
The answer is: Down. If you look at today's chart, you can see that Institutional Accumulation has been making lower/highs and lower/lows. That is the definition of a down trend. That down trend went to a Distribution condition for 5 trading days during the October 1 to October 7 period of time. The peak Distribution day was October 2nd, after which Distribution started abating.
So, even though we are back into Accumulation, the Accumulation is "down trending" indicating that Institutional Investors are selling into the rally. If the down trend continues, then logically, the next Institutional selling spurt would have a lower/low with a negative impact on the market. (Today's Institutional Buying/Selling chart is presented as a courtesy to our Free Members today. This chart is posted every day on our paid subscriber site.)
** Feel free to share this page with others by using the "Send this Page to a Friend" link below.
By Marty Chenard
http://www.stocktiming.com/
Please Note: We do not issue Buy or Sell timing recommendations on these Free daily update pages . I hope you understand, that in fairness, our Buy/Sell recommendations and advanced market Models are only available to our paid subscribers on a password required basis. Membership information
Marty Chenard is the Author and Teacher of two Seminar Courses on "Advanced Technical Analysis Investing", Mr. Chenard has been investing for over 30 years. In 2001 when the NASDAQ dropped 24.5%, his personal investment performance for the year was a gain of 57.428%. He is an Advanced Stock Market Technical Analyst that has developed his own proprietary analytical tools. As a result, he was out of the market two weeks before the 1987 Crash in the most recent Bear Market he faxed his Members in March 2000 telling them all to SELL. He is an advanced technical analyst and not an investment advisor, nor a securities broker.
Marty Chenard Archive |
© 2005-2022 http://www.MarketOracle.co.uk - The Market Oracle is a FREE Daily Financial Markets Analysis & Forecasting online publication.