


Gold and Silver Quick Consolidation or Serious Breakdown?
Commodities / Gold & Silver 2009 Oct 04, 2009 - 05:38 PM GMT

 In my previous essay, I commented i.a. on the situation in the U.S. Dollar. I wrote the following:
There are several factors that make me think that we may move a little higher - above 77 but not higher than the 78 level. The declining trend line (thick blue line) provides a solid resistance right now, and it has not been reached yet. Moreover, the breakdown below December 2009 low has not been verified yet, and a brief move higher from here would verify it.
This is precisely what we have seen this week – USD moved slightly higher, yet gold and silver managed to close this week a little higher as well. This type of action during consolidations (rising despite fairly negative influence from other markets) signals strength of the precious metals.
Speaking of consolidations, let’s turn to the gold chart (charts courtesy of http://stockcharts.com) and see what it did this week, to estimate what is likely to take place next.
Gold
The yellow metal is currently hovering at the $1,000 level. Since this is such important number from a long-term point of view, I believe a weekly chart would be particularly useful to analyze the situation:
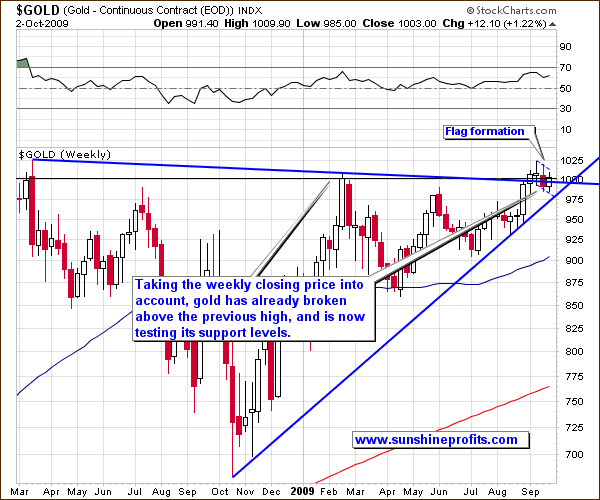
Once we take a look at gold from this perspective, it becomes noticeable that in terms of weekly closes gold has already broken above the previous highs, and is now verifying this breakout. So far it has been successful, as the price closed below the $1,000 level only last week, but bounced higher this week.
Moreover, on this chart you can see the flag formation marked with thin, dashed lines. This pattern suggests continuation of the previous trend, and that the following rally will be at least as large as the preceding move. This would imply gold above $1,050 – high enough to convince many people that $1,000 has been taken out for good.
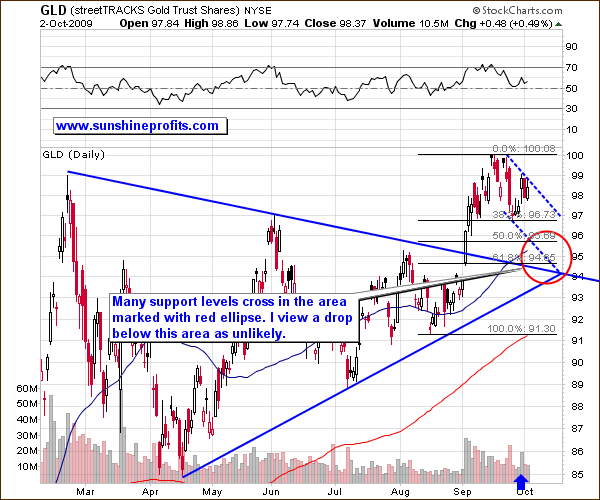
From a short-term point of view, it seems that the price of gold may correct a bit before a big rally materializes. As always, the Fibonacci retracement levels provide us with valuable support areas, which are strengthened by several other support lines. Most of the support levels cross at the area marked with red ellipse, so it is very likely to stop the decline.
This would more or less correspond to the ABC correction pattern, which is often seen in the metals market – a move lower would be the C part. Taking the long-term charts into account, it seems that the upper part of the ellipse, and the 50% Fibonacci retracement level (at 95.69 in the GLD ETF) are most likely to stop the decline, as they also correspond to the rising long-term support line (visible on the weekly chart.)
Gold Stocks
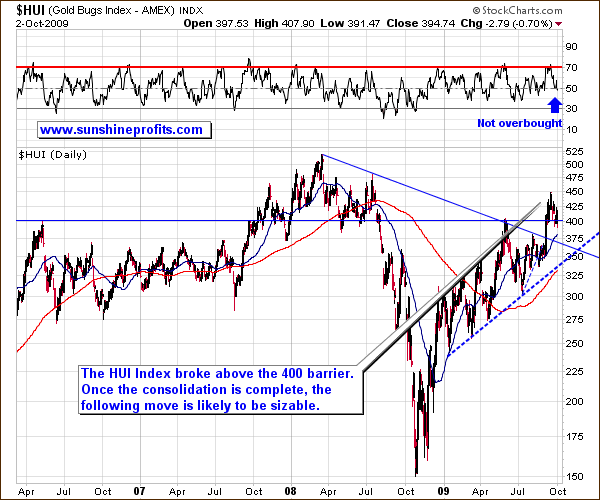
Moving on to the mining stocks, it appears that the breakout above the critical $400 level has been verified by several days when HUI closed above it. Since that was the case, we don’t need to worry too much about Friday’s close below $394.74, slightly lower than $400. Whether or not we will see HUI even lower on a short-term basis is based on the action in other markets. Since I mentioned earlier that a move higher is likely to follow after another small drop in gold and silver, it suggests a similar action in the mining equities. Let’s take a look at the short-term chart for more details.
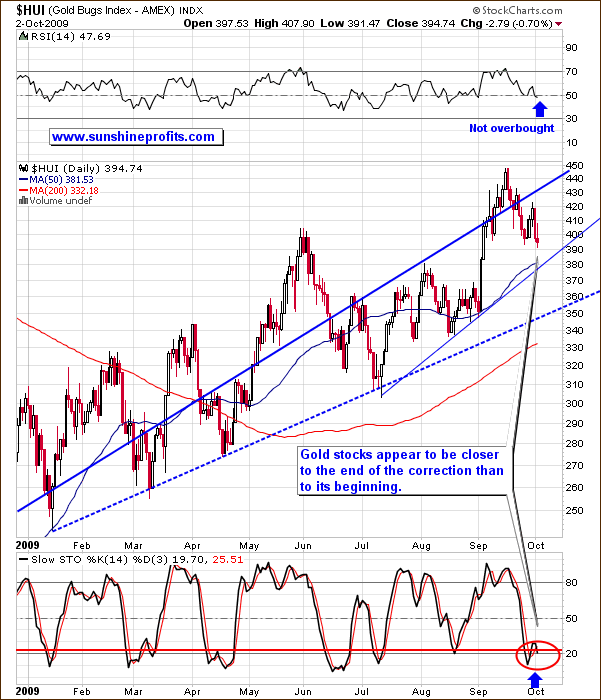
Short-term chart suggests that a downswing is close to being completed, as HUI Index is relatively close to the rising support line (currently at the $380 level). This would correspond also to the zigzag (ABC) pattern. As mentioned in the past, precious metals tend to correct in a zigzag fashion, and this time we could see another example of this tendency, meaning that the bottom is rather near, as the A, B and about half of the C part are behind us.
The Stochastic Indicator provides us with additional signal, as it was just below levels that meant temporarily oversold condition in the past, and it appears to move into this area once again. This type of behavior characterized local bottoms in the past so we may infer that one will emerge soon.
Not every important mechanism is directly visible on the above charts featured above, so let’s turn to our indicators for more clues.
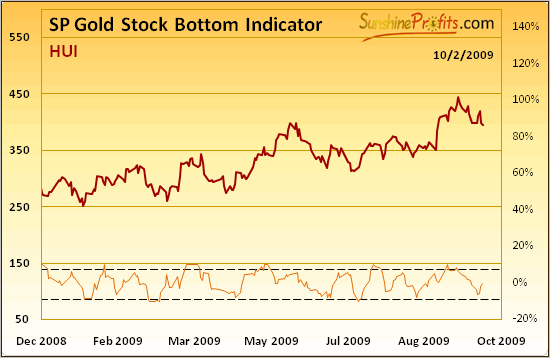
The SP Gold Stock Bottom Indicator recently moved near the lower dashed line. Generally, touching, or breaking through it means a buy signal. This did not take place yet, but please note that in the past bottoms materialized also when the orange line was just about to generate a buy signal, but finally didn’t do so. In other words, when this indicator goes very near the dashed line, the probability that the bottom is in increases significantly.
Again, it was usually the initial downswing that took this indicator to the ‘buy’ level, so it does not invalidate the above analysis – another small move down is not out of the question. Should it take this indicator below the dashed line, it would signals another favorable entry point.
Summary
The precious metals have been correcting the previous rapid rally that took gold over $1,000, but the question here is if the bottom is already in. Based on the above analysis, it seems that PMs are likely to move a little lower before resuming their main direction – up. Should the USD Index move lower sharply, we are likely to see gold and silver soar. Another critical signal comes from the analysis of the general stock market, but I will leave this part of the analysis to my Subscribers.
To make sure that you get immediate access to my thoughts on the market, including information not available publicly, I urge you to sign up for my free e-mail list. Sign up today and you'll also get free, 7-day access to the Premium Sections on my website, including valuable tools and charts dedicated to serious PM Investors and Speculators. It's free and you may unsubscribe at any time.
P. Radomski
Editor
Sunshine Profits
Interested in increasing your profits in the PM sector? Want to know which stocks to buy? Would you like to improve your risk/reward ratio?
Sunshine Profits provides professional support for precious metals Investors and Traders.
Apart from weekly Premium Updates and quick Market Alerts, members of the Sunshine Profits’ Premium Service gain access to Charts, Tools and Key Principles sections. Click the following link to find out how many benefits this means to you. Naturally, you may browse the sample version and easily sing-up for a free trial to see if the Premium Service meets your expectations.
All essays, research and information found above represent analyses and opinions of Mr. Radomski and Sunshine Profits' associates only. As such, it may prove wrong and be a subject to change without notice. Opinions and analyses were based on data available to authors of respective essays at the time of writing. Although the information provided above is based on careful research and sources that are believed to be accurate, Mr. Radomski and his associates do not guarantee the accuracy or thoroughness of the data or information reported. The opinions published above belong to Mr. Radomski or respective associates and are neither an offer nor a recommendation to purchase or sell securities. Mr. Radomski is not a Registered Securities Advisor. Mr. Radomski does not recommend services, products, business or investment in any company mentioned in any of his essays or reports. Materials published above have been prepared for your private use and their sole purpose is to educate readers about various investments.
By reading Mr. Radomski's essays or reports you fully agree that he will not be held responsible or liable for any decisions you make regarding any information provided in these essays or reports. Investing, trading and speculation in any financial markets may involve high risk of loss. We strongly advise that you consult a certified investment advisor and we encourage you to do your own research before making any investment decision. Mr. Radomski, Sunshine Profits' employees and affiliates as well as members of their families may have a short or long position in any securities, including those mentioned in any of the reports or essays, and may make additional purchases and/or sales of those securities without notice.
Przemyslaw RadomskiArchive |
© 2005-2022 http://www.MarketOracle.co.uk - The Market Oracle is a FREE Daily Financial Markets Analysis & Forecasting online publication.