


Crack Up Boom Part IV - Gold, Oil and the Dollar
Commodities / Global Financial System Jun 28, 2007 - 01:37 AM GMTBy: Ty_Andros

The Crack-up Boom Series Part IV Introduction
The Crack Up Boom series is exploring the unfolding “Indirect Exchange” (as detailed by Ludvig Von Mises), that dollar holders will be using to exit their holdings now and eventually is will be followed by all holders of fiat currency holdings no matter which country is perpetrating the “fraud” of confiscation of wealth through the printing and credit creation process that all such monetary schemes evolve into. The “Crack Up Boom” will drive an inflationary global expansion to inconceivable heights over the coming years. Asset prices will skyrocket as people do what they always do when threatened, they will modify their behavior and do the things necessary for “SELF PRESERVATION” of their families, countries, economies and their wealth. Let's take a look at Von Mises description of the CRACK UP BOOM once again:
This first stage of the inflationary process may last for many years. While it lasts, the prices of many goods and services are not yet adjusted to the altered money relation. There are still people in the country who have not yet become aware of the fact that they are confronted with a price revolution which will finally result in a considerable rise of all prices, although the extent of this rise will not be the same in the various commodities and services. These people still believe that prices one day will drop. Waiting for this day, they restrict their purchases and concomitantly increase their cash holdings. As long as such ideas are still held by public opinion, it is not yet too late for the government to abandon its inflationary policy.
But then finally the masses wake up. They become suddenly aware of the fact that inflation is a deliberate policy and will go on endlessly. A breakdown occurs. The crack-up boom appears. Everybody is anxious to swap his money against "real" goods, no matter whether he needs them or not, no matter how much money he has to pay for them. Within a very short time, within a few weeks or even days, the things which were used as money are no longer used as media of exchange. They become scrap paper. Nobody wants to give away anything against them.
It was this that happened with the Continental currency in America in 1781, with the French mandats territoriaux in 1796, and with the German mark in 1923. It will happen again whenever the same conditions appear. If a thing has to be used as a medium of exchange, public opinion must not believe that the quantity of this thing will increase beyond all bounds. Inflation is a policy that cannot last. Thank you Ludvig.
Unfortunately, for us all this is now NOT an isolated currency policy as detailed in the last paragraph, as globally virtually “ALL” governments are pursuing this policy at this point. So first we will see the biggest offenders suffer from their hubris AKA the “UNITED STATES” then it will rotate to all countries who follow such monetary policies. Public Servants always and every time have become Public Serpents robbing their constituents to further their personal ambitions and collection of power and wealth.
Gold, Oil and the dollar
Today we are going to take a look at how DOLLAR holders are spending their dough. May analysts “Including me” are looking for a vicious pullback to emerge in global stock markets as they have gotten ahead of themselves as dollar holders have exercised the “INDIRECT EXCHANGE” detailed by Von Mises above. However, there are some curious things emerging as gold and oil are looking like they will become the destination of choice as the stock markets work off their excessive exuberance. The stock markets are in a “Finger of Instability” as excellent fundamentals have combined with too much liquidity to get ahead of themselves. (For “Fingers of Instability” see Ted bits archives at www.TraderView.com )
Combine this with a yield curve that is normalizing, indigestion can be expected in global stock indices as they adjust to the emerging reality of higher inflation and a normal yield curve. Since stocks are correcting an amazing run stretching back to the lows in July of last year expect to correction to last until this fall sometime. Since June of last year the S&P 500 has been up 12 of 13 months and currently is at 1520, it needs to correct and rest, the 20 month moving average is at 1369, a move back to this level is not anything but a reversion to the mean in a longer term uptrend (expect some hysterical reporting of this correction, setting the table for more DOLLAR, currency and credit creation worldwide). Then expect the dollar holders to move in “EN MASSE” and gobble up these stocks at discounts to today's prices.
Conversely, Gold and Oil have worked through their respective pullbacks (both in time and price) and look poised to resume their climbs. The inflationary boom which I am expecting will represent over 3 billion people on the bid, emerging into middle classes over the next several generations as the magic of Austrian economics and Capitalism combine to work their timeless recipe for wealth creation. This inflationary cycle has only just begun so let's take a close look at Gold and Oil.
We are going to look at gold through two lenses, the first being gold itself then the next one will include gold stocks as represented by Canada, both will be utilizing longer term weekly or monthly charts to facilitate longer term pictures. This first chart and explanation are courtesy of our occasional contributor Garrett Jones:
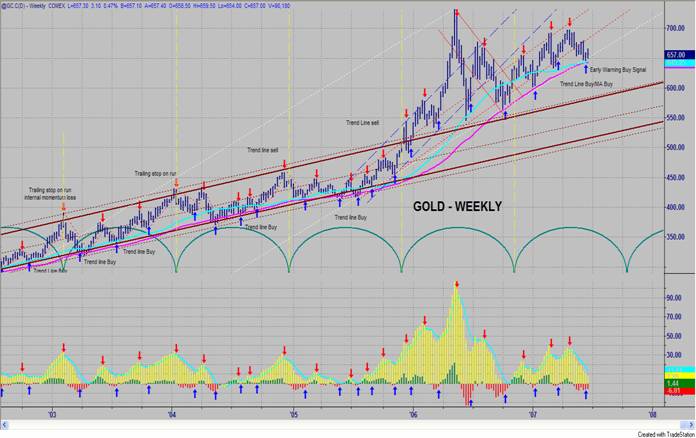
This is an interesting juncture for gold. The big picture is that it should be clear that gold is a very important commodity to own. The Monthly chart is and has been overbought -- that, however, is a condition that may stay with gold throughout this current bull market. With gold, "overbought" is much more of a technical term because as you view the fundamentals, it is probably a lot more accurate to view gold as undervalued.
The attachment is my weekly chart. For a lot of reasons this is my favorite gold chart. The weekly time frame is optimal as it is “just right” i.e. not too long term and not too short term. Let's take a look at what gold has done on this chart. The first thing you notice is the channel outlined by brown lines. This is the basic trend for gold since the bull market began in 2001. In December of 2005, it broke out of this “normal trading range” and began to define a sharper vector angle. It went mildly parabolic into the May 2006 top and then fell all the way back down to test its old channel. In fact, it tested it twice. Since that time, gold has established a vector angle that is in between its old channel and the newer aggressive channel. It is currently, testing the bottom of this channel.
Gold is currently in a rather unique technical position. The light blue line is a 200 day (40 week) moving average and the dark pink line is a 300 day (60 week) moving average. When these two lines are together and price moves down to the lines, it is usually a support level that you can trade with confidence. Note we also have the lower channel line of the recent channel as support, too. Getting back to the 200 and 300 day moving averages, they are also resistance if price is approaching them from below. Historically, the two lines don't meet that often and they rarely meet at a channel high or low -- or a meaningful trend line (it is on the trendline). As you can see, the dotted white channel lines are major channel lines and the lower dotted white channel line is a very meaningful trend line.
Historically, these junctures have been major turning points the vast majority of the time. In fact, they have occasionally been good warning signals of unexpected news events that send gold on a powerful move …we'll see! Thank you Garrett (Garrett can be reached at garrett111@comcast.net ).
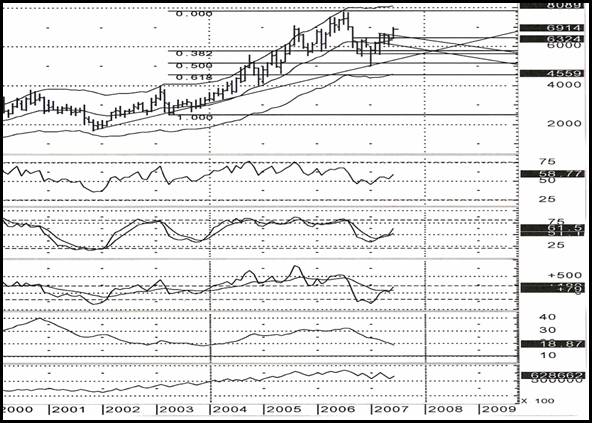
Now let's look at some VERY interesting work by Tim Ord at www.ord-oracle.com that brings the universe of gold stocks into the picture:
Above is the Capped Gold Index ($sptgd) with it's ·Price Relative to Gold· ratio. The Capped Gold index is like the Canadian XAU. The CCI (Commodity Channel Index) is a momentum indicator and is useful in identifying overbought and oversold levels. On the chart below is the Capped gold index dating back to late 2000 on a weekly timeframe with the weekly CCI in the middle window. It·s rare to have the weekly CCI trade below -100.
Since late 2000 the weekly CCI has traded below -100 six times (the current reading is below -100) and the previous five weekly -100 readings produced significant rallies that last 3 months minimum and some last nearly a year. The Price Relative to Gold for the Capped Gold index now reached a level (below .45) not seen since late 2000 and early 2001 and is a very bullish reading. We have marked on the chart below the times when the weekly CCI was below -100 and Price Relative to Gold was below .45 at the same time (circled in RED). When both the Price Relative to Gold was below .45 and the weekly CCI below -100, significant rallies were produced and this combination picked the two most significant rallies since the 2000 bottom which were the rallies of 2003 and 2005. Long the Xau at 142.42 on 6/1/07 . Thank You Tim.
What are both of these analyses screaming? Its time to get long . In the case of Tim's work, look very closely at the extent of the oversold conditions of the oscillators and the VERY DEEP oversold condition we are currently at in contrast to previous buy signals going back to 2001 (arguably the bottom of the previous bear market). Gold is coiled like a spring, Ce ntral bank sales and market manipulation efforts by the authorities have created an explosive situation. And recently failed as massive sales were unable to push the price below Garrets channel, my guess is Emerging world central banks were the bidders, quietly taking this valuable reserve asset in an “INDIRECT EXCHANGE” for the ultimately worthless ones they now hold “also known as” as DOLLARS!
Ted bits note: at times like these it is easy for the Ce ntral banks to get a fairly good “BANG” for the buck by selling right here, screwing up the charts for the technical traders and investors alike causing a short term DISRUPTION in the ingoing BULL MARKETS. Be on the lookout for a thumb to come down on the Gold to create a PSYCHOLOGY of lower inflation. But in reality it is just stretching the rubber band a little tighter (see Tim Ord's oscillators) setting the stage for a more explosive move out of the lower prices!!!
Now let's look at Crude oil. The life blood of the modern world and the economy. First we will look at the monthly charts which are immensely bullish and we can see a correction in both “TIME AND PRICE”. In this chart we can see the trend line drawn off the November 2001 lows (coincidently about the same time GOLD made its final lows). Notice how the recent decline to fifty dollars was only able to “Kiss” the trendline. Buyers emerged in force.
Looking closely we can also see that the market had an intermediate to long-term correction in terms of price as the price retreated into the “BOX” represented by the 50 to 61.8% Fibonacci retracements levels. The time from low to high on this chart is 36 months, and the correction occurred over the last 12 months, 33%, an almost perfect Fibonacci 38% in terms of time. Looking closely over the last 12 months, we can also see a reverse head and shoulders, with a breakout higher, a retest of the breakout combined with a 3 month long bull flag, with a solid breakout higher in June of this year. MACD, and Slow stochastic's have already given buy signals, RSI is a low for a bull market (in bull markets the relative strength index, usually only retreats to neutral) with lots of room to run. ADX has reset to levels which can accommodate trend resumption based on historical's. On balance volume has also retreated to areas from which it can resume its rise.
Many analysts are signaling the end of the world as it is clearly apparent in the technical's emerging in the US stock market that a MAJOR correction is emerging on the near horizon. A correction is long overdue. “POOR BABIES”, markets are about to do what they always do, “correct, revert to the mean, and work off overbought conditions”. Nothing but healthy action! And it could be deep as the patterns in the years ending in 7 going back over a hundred years would indicate. Add in the NORMALIZATION of the yield curve, which technically is being confirmed on the charts.
The technical analysis in this article is a clear shot across the bow to bond holders that inflation can be expected to increase as oil is poised to resume the next leg in this ongoing bull market in energy. DO YOU REALLY THINK GOLD CAN RETREAT SIGNIFICANTLY IF CRUDE HEADS HIGHER? The answer is NO! Conditions in the global grain markets are flashing “critical mass” (global consumption of wheat and corn have EXCEEDED production for 6 of the last 7 years, the cupboard is bare) and explosive bull markets are in full BLOOM.
The next leg up in commodities and the new reality of accelerating inflation and normalized yield curves need to be priced into the stock and bond markets, before the stock market advance can continue and it could be ugly. But you can expect one thing when this “Finger of Instability” has run its course: DOLLAR holders will emerge and buy the on sale assets in the ongoing “INDIRECT EXCHANGE” that the “CRACK UP BOOM” implies. Sovereign Wealth funds (along with Global Plunge protection teams) can be expected to be buyers of probable October lows from considerably lower prices, and of course this retreat in asset markets sets the table for the next round of REFLATION by fiat money and credit creation for the asset backed economies of the G7 group of countries. It should be a breathtaking 4 or 5 months, long commodities as they explode higher and short paper assets as they get cut down to size.
In Conclusion, this is not short term analysis don't confuse short term with long term. Primary bull markets are in full bloom in the emerging world economies and in grains, raw materials, precious metals, energy and commodities in general, sharp pullbacks in commodities can occur as the financial markets PRICE IN the ongoing erosion of their underpinnings by the commodities bull markets. Don't be fooled that this is DEFLATION emerging, it is deflation emerging in paper, ie. Currencies and credit markets.
This deflation in paper only sets the table for the next round of cubic monetary and credit stimulus as it steps up to meet the systemic financial system challenges it poses to the asset backed economies of the G7. Government actions at this time are predictable as inflation IS the policy that is being pursued by the G7 Public servants and financial authorities. As outlined by Ludvig, “ They (the public) become suddenly aware of the fact that inflation is a deliberate policy and will go on endlessly. The broad public still expects inflation to recede, I talk to investors every day that do so.
All the fundamental information you can collect in the newspapers are in the charts at the end of the day week, month, quarter and year, and they all are a chorus indicating “HIGHER PRICES” ahead. If measured in fiat currencies . Ultimately the public will be right above receding inflation, but as Jesse Livermore said “Markets can stay irrational longer than you can stay solvent”. In my estimation this is a 15 to 20 year affair/event from the lows in 2002. Don't invest your portfolio based on the big event, let the charts do their talking, and listen to what they are saying!!! Then set your sails and let the markets come to you and your portfolio. As I have outlined in this missive, you need to be able to make money in markets as they “GO UP” (commodities, stuff and things that can't be printed) and “GO DOWN” (paper assets, bombs, er bonds, cash) in “FINGERS OF INSTABILITY”, this is what I do! Make investments in things that go up or down and we don't care as we have the potential to make money in either direction. If you are interested in learning about some solid portfolio diversification utilizing absolute return alternative assets please contact me at www.TraderView.com , I would like the opportunity to serve you! . Don't miss the next edition of the “CRACK UP BOOM” series. Thank you.
If you enjoyed this edition of Tedbits then subscribe – it's free , and we ask you to send it to a friend and visit our archives for additional insights from previous editions, lively thoughts, and our guest commentaries. Tedbits is a weekly publication that comes out on Thursdays or Fridays.
By Ty Andros
TraderView
Copyright © 2007 Ty Andros
Tedbits is authored by Theodore "Ty" Andros , and is registered with TraderView, a registered CTA (Commodity Trading Advisor) and Global Asset Advisors (Introducing Broker). TraderView is a managed futures and alternative investment boutique. Mr. Andros began his commodity career in the early 1980's and became a managed futures specialist beginning in 1985. Mr. Andros duties include marketing, sales, and portfolio selection and monitoring, customer relations and all aspects required in building a successful managed futures and alternative investment brokerage service. Mr. Andros attended the University of San Di ego , and the University of Miami , majoring in Marketing, Economics and Business Administration. He began his career as a broker in 1983, and has worked his way to the creation of TraderView. Mr. Andros is active in Economic analysis and brings this information and analysis to his clients on a regular basis, creating investment portfolios designed to capture these unfolding opportunities as the emerge. Ty prides himself on his personal preparation for the markets as they unfold and his ability to take this information and build professionally managed portfolios. Developing a loyal clientele.
Disclaimer - This report may include information obtained from sources believed to be reliable and accurate as of the date of this publication, but no independent verification has been made to ensure its accuracy or completeness. Opinions expressed are subject to change without notice. This report is not a request to engage in any transaction involving the purchase or sale of futures contracts or options on futures. There is a substantial risk of loss associated with trading futures, foreign exchange, and options on futures. This letter is not intended as investment advice, and its use in any respect is entirely the responsibility of the user. Past performance is never a guarantee of future results.
Ty Andros Archive |
© 2005-2022 http://www.MarketOracle.co.uk - The Market Oracle is a FREE Daily Financial Markets Analysis & Forecasting online publication.