


Portfolio Asset Allocation Analysis
Portfolio / Investing 2009 Sep 30, 2009 - 09:45 AM GMTBy: Richard_Shaw

 It can be useful to know how the average other guy is allocating assets, whether you are inclined to follow the crowd or to do something else.
Asset Allocation Among Public Investment Funds:
This table shows the asset allocation among public investment funds available in the U.S. segmented by equity funds, bond funds, money market funds and hybrid funds (they invest in both stock and bonds). There is no separation of domestic, international and global assets in these data.
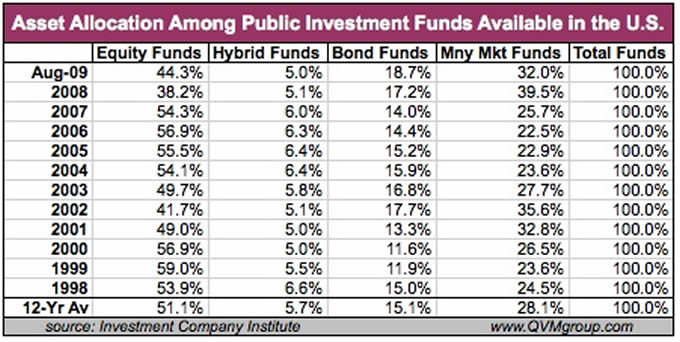
These figures do not include variable annuities. The figures do include assets from both individual investors and institutions or private funds that invest through public funds.
The current equity allocations are the lowest they have been in the past twelve years, except for 2008 and 2002, both bear market bottom areas. That suggests there is more money yet to be allocated to stocks as risk aversion abates.
Bond allocations are the highest they have been in twelve years, which we expect is as much a function of the aging baby boomers as it is risk aversion caused by the recent bear.
Money market assets are higher than the twelve-year average, but not as high as they were in 2008 or 2002. What we don’t know is how much money market oriented cash has migrated to bank CD’s due to the combination of negligible money fund rates, and the loss of faith in the $1.00 fixed price of money funds due to the 2008 debt market liquidity freeze.
Hybrid funds have somewhat below average allocation, but the category is not major.
Keep Perspective When Reading News:
Beware of forming opinions with data out of context. For example, on September 28, Bloomberg published an article with a correct fact, but perhaps a false implication. The article was titled “Obama Stock Advance Persists on Money Fund Hoarding“. The first paragraph said:
“Americans holding $3.5 trillion in cash are giving money managers increasing confidence that the stock market rally under President Barack Obama will continue through the end of the year.“
The financial data is right (the Obama linkage to the money fund data is a gratuitous toss-in) and the implication that the entire $3.5 trillion may flow to stocks is essentially false.
By examining historical allocations, it is clear that over up and down cycles, there are substantial money fund holdings. Over the past twelve years, the lowest money fund allocation among public funds was about 23%, which translates to a likely stable cash reserve in money funds today of about $2.3 trillion.
Our impression is in accord with the Bloomberg article, in that there is cash on the side to come into stocks, but we would judge the amount of money available for reallocation to stocks to be more like $1.2 trillion. That amount is fairly consistent with a fact found later in the Bloomberg article, “Investors placed $1.45 trillion in U.S. money market funds in 2007 and 2008.”
It looks to us as if the amount of money that moved into money funds during the declining market is the amount of money that may come back to stocks, not the total amount in money funds.
Assets by Type of Fund:
Mutual funds in August accounted for 92.5% of public investment fund assets in the U.S., while ETFs accounted for only 5.7% of assets. UITs and CEFs made up the difference.
Average Fund Dividend Rates:
In 2008, the total of all fund dividends (from interest and dividends received from fund underlying assets) was 2.66% of all fund assets — bond funds, stock funds, hybrid funds and money market funds combined.
Total Fund Assets:
Public investment funds available in the U.S. in August totaled $10.4 trillion.
U.S. Fund Assets vs Worldwide Fund Assets:
Total mutual fund assets in the U.S. in 2008 were $9.7 trillion, while worldwide mutual fund assets were $19.0 trillion — 51% of worldwide mutual fund asset were in funds available through the U.S.
Index Funds:
Index funds have an increasing role in portfolios. In 2008, 13% of equity funds were index funds, up from 8.9% ten years earlier, and up from 3.3% fifteen years earlier. S&P 500 index funds account for 40% of index fund assets. That means that SPY, IVV, VFINX and other S&P 500 index funds account for 5.2% of public equity fund assets.
Number of Funds vs Number of Stocks:
There were over 10,000 public funds (8,889 mutual funds, 646 closed-end funds, and 743 ETFs) registered in the U.S at year-end 2008, which is substantially more than the number of US stocks that most investors would consider owning.
The S&P 500 index (proxy SPY or IVV) covers 500 stocks. MSCI U.S. Prime Market index (proxy VTI) covers about 1,750 stocks. The Russell 3000 index (proxy IWV) covers 3,000 stocks, and the Dow Jones Total Market index (proxy TMW) covers 5,000 stocks.
It’s been this way for a long time, but keep in mind that there are more investment funds available than there are individual stocks worth thinking about. Are there really enough good ideas to support that many fund portfolios with differentiated composition, approach or results? Probably not.
Allocation Redux:
After allocating the hybrid funds 60/40 to stocks/bonds (an assumption based on the “classic” balanced fund model), the current allocation of public fund assets available in the U.S. is about 47% equities, 19% bonds and 32% money market funds.
We speculate by looking at past allocations and the likely trend toward somewhat higher bond allocations, that when markets normalize, the average allocation will be something like: 55% to 60% equities, 30% to 35% bonds, and 5% to 10% money markets.
Of course averages can be deceptive. Two investors, one 100% stock and one 100% bonds, have an average allocation of 50%/50%, yet neither looks anything like that. Nonetheless, based on millions of accounts the averages are potentially helpful to understand as you decide to go with or against the crowd.
Disclosure: We hold several of the named securities in various portfolios.
By Richard Shaw
http://www.qvmgroup.com
Richard Shaw leads the QVM team as President of QVM Group. Richard has extensive investment industry experience including serving on the board of directors of two large investment management companies, including Aberdeen Asset Management (listed London Stock Exchange) and as a charter investor and director of Lending Tree ( download short professional profile ). He provides portfolio design and management services to individual and corporate clients. He also edits the QVM investment blog. His writings are generally republished by SeekingAlpha and Reuters and are linked to sites such as Kiplinger and Yahoo Finance and other sites. He is a 1970 graduate of Dartmouth College.
Copyright 2006-2009 by QVM Group LLC All rights reserved.
Disclaimer: The above is a matter of opinion and is not intended as investment advice. Information and analysis above are derived from sources and utilizing methods believed reliable, but we cannot accept responsibility for any trading losses you may incur as a result of this analysis. Do your own due diligence.
Richard Shaw Archive |
© 2005-2022 http://www.MarketOracle.co.uk - The Market Oracle is a FREE Daily Financial Markets Analysis & Forecasting online publication.