


Bond Yields Yet to Confirm the New Stocks Bull Market
Stock-Markets / Stock Index Trading Sep 29, 2009 - 04:10 AM GMTBy: Donald_W_Dony

 Over the past two decades, the US yield curve has been a very reliable indicator to the major peaks and troughs in the stock market. The periods in which the curve is steepest correlates closely to the bottom of the bear market. The opposite develops at market tops. When the yield curve is flat, this occurs at the top in the bull market.
Chart 1 shows the relative strength comparison between the longer-term US Treasury 10-year yields and the shorter 2-year yields. At the top of the last bull market in 2000, the yield curve was flat. As the 2000 to 2002 bear market took hold, the yield curve greatly steepened. 10-year yields rose and the short-term 2-year rates quickly dropped. The Fed typically lowers the lending rate during a contraction in the business cycle. This action is designed to help stimulate consumer spending and 'kick start' the economy. In 2003, 2-year bond yields had declined to their lowest level and greatest spread over the 10-year yields. This crest in the yield curve was within 6 months of the final bottom to the 2000-2002 bear market.
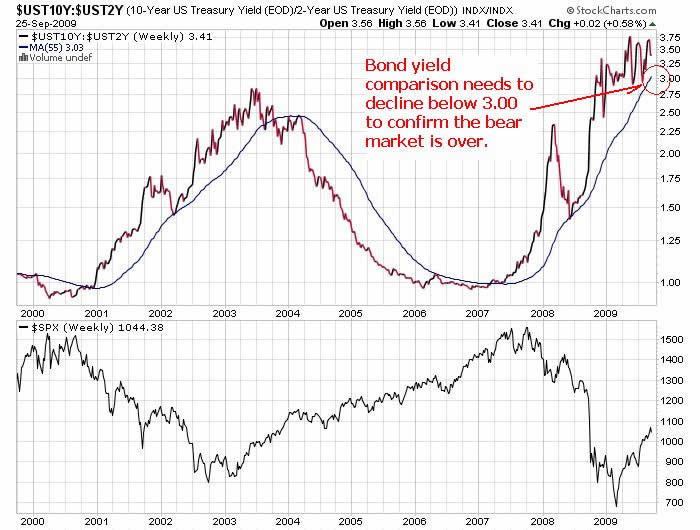
The pattern slowly reversed as the new bull market began to gain traction. From 2003 to 2007, the 2-year Treasury yield gradually rose against the longer 10-year yield. The Fed was attempting to cool the economy by hiking the lending rates which makes loans more expensive. By late 2007 and early 2008, short and long-term rates were similar producing a flat curve. The last time the yield curve was flat was in 1999-2000, at the peak of the previous bull market.
The threat of a weakening economy in 2008 forced the Fed to quickly lower short-term interest rates and cause the yield curve to once again spike upward.
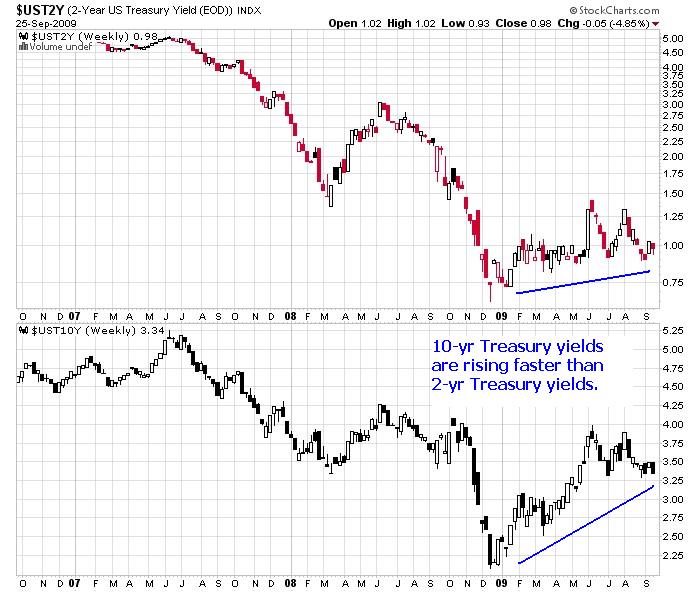
Chart 2 illustrates the two individual Treasury bond yields. Both rates were decreasing in 2007 and 2008, however, the 10-year yields declined at a slower pace. In 2009, the longer bond rates began to climb faster than the short 2-year rates. This action helped maintain the present steep yield curve. Models suggest that the 2-year yields will remain at the current levels and the 10-year rates should rise slightly. This anticipated movement should keep the yield curve at its present angle into Q4.
Bottom line: The US yield curve provides a valuable timing tool to the S&P 500. Though the movement of the curve sometimes lags the stock market by as much as six to eight months, its data adds confirmation to a new trend in equities. The ratio needs to fall below 3.00 before the yield curve can provide substantiate evidence of the longer-term advance in stocks.
More research can be found in the October newsletter. Go to www.technicalspeculator.com and click on member login.
Your comments are always welcomed.
By Donald W. Dony, FCSI, MFTA
www.technicalspeculator.com
COPYRIGHT © 2009 Donald W. Dony
Donald W. Dony, FCSI, MFTA has been in the investment profession for over 20 years, first as a stock broker in the mid 1980's and then as the principal of D. W. Dony and Associates Inc., a financial consulting firm to present. He is the editor and publisher of the Technical Speculator, a monthly international investment newsletter, which specializes in major world equity markets, currencies, bonds and interest rates as well as the precious metals markets.
Donald is also an instructor for the Canadian Securities Institute (CSI). He is often called upon to design technical analysis training programs and to provide teaching to industry professionals on technical analysis at many of Canada's leading brokerage firms. He is a respected specialist in the area of intermarket and cycle analysis and a frequent speaker at investment conferences.
Mr. Dony is a member of the Canadian Society of Technical Analysts (CSTA) and the International Federation of Technical Analysts (IFTA).
Donald W. Dony Archive |
© 2005-2022 http://www.MarketOracle.co.uk - The Market Oracle is a FREE Daily Financial Markets Analysis & Forecasting online publication.