


Inflation, Deflation or Economic Growth? Markets Will Answer Soon
Stock-Markets / Financial Markets 2009 Sep 27, 2009 - 07:19 PM GMTBy: The_BullBear

 Markets are at an important inflection point and the inflation vs. deflation vs. growth debate may be resolved soon.
SUMMARY
All of the markets that I follow have reached important decision points. Collectively the direction of the moves coming out of the present configuration will describe market and economic conditions going forward. There does seem to be growing evidence that the deflationist scenario may ultimately hold sway. However, arguments for deflation, inflation and growth all find substantiation in the current market environment. At this time traders are best advised to pare back their market exposure or go to cash and wait for the markets to make their intentions known. Commodities do appear to be close to a decisive bearish move and may represent a shorting opportunity. If that is the case, can a bullish move in the US dollar be far behind?
COMPARATIVE ANALYSIS
Debate on the future direction of world markets and the global economy tends to be divided between inflationist and deflationist views with advocates of a growth scenario coming in a distant third. In general, a bearish consensus still holds sway even after a better than 50% rally in world equity markets. The bear arguments even tend to the apocalyptic with calls for a renewed financial and economic crisis still prevalent. At the same time, voices calling for 3-4% growth in the next quarter in the US and worldwide are also growing in number and volume. The gap between these opposing viewpoints is widening and creating a very interesting dynamic.
The Deflationist camp, the leading advocate of which is Robert Prechter, argue that debt destruction is the primary economic force at this time. In spite of massive inflationary fiscal and monetary policy, credit is shrinking as debt and dollars are being retired in a spiral downward. A deflationary depression similar to the 1930's is the ultimate result of this process according to the advocates of this view. Reports of collapsing consumer credit, declining loan volumes, Asian ports choked with idle cargo ships and stagnating and now declining commodity prices tend to support this conclusion.
The Inflationists argue that the history of Keynsian fiscal and monetary policy capped by the current unprecedented inflationary policy is leading to another asset price bubble unfounded in real economic growth and the result will be another violent financial system collapse followed by a hyperinflationary depression or stagflationary recession as governments and central banks continue to pump liquidity into the system. In this scenario commodities, particularly gold and silver, will be the only asset classes to keep up with inflation and preserve wealth. The dollar would fall into a death spiral and ultimately be replaced by a new, potentially global, currency regime. Some feel that this could play out relatively soon and others that this would come about in 18-36 months. The recent breakout in gold and silver and the meteoric rise in equities tends to support this view. An leading proponent of this perspective might be Peter Schiff.
The proponents of Growth argue that the bull run in equities off the March 2009 bottom represents a secular bottom and that the rally is forecasting strong economic growth in the future. The sheer panic and rampant fear of economic Armageddon in March is the kind of sentiment that marks turning points. The Nasdaq 100 technology stocks have provided clear leadership and have broken out of a 9 year downtrend with authority. Predictions of 2-4% GDP growth in the coming quarter are becoming more common.
My perspective as a technical analyst and contrarian is this: rather than intellectually hypothesizing about future events within the parameters of an establshed viewpoint, we should listen to the message of the markets. That message may be mixed and unclear as it is now. And the fact of that lack of clarity may reflect a more complex dynamic than any of the proscribed schools of thought encompass individually.
Up until this point, the message of the rising market for equities must be interpreted as either a prediction of future strong economic recovery or another inflationary asset price bubble. When and if the trend fails we can then ask if the message the market is sending is now different. The only other clear and valid market message available at this time comes from the commodities markets. Commodities are in a bear market with a recent breakdown and a significant divergence from the SPX since June. We must interpret that message as either favoring the deflationary or growth scenarios. Obviously, if commodity prices are depressed or flat this implies a strengthening dollar and a recessionary economic outlook. Flat commodity prices may also be encompassed in a Goldilocks scenario in which GDP grows yet input prices remain steady as in the period from 1995-2000.
I'll expand on these themes as we look at the charts.
TECHNICAL ANALYSIS
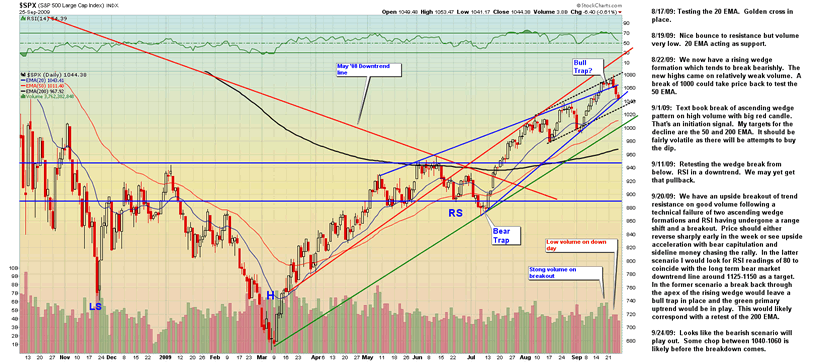
The S&P 500 (SPX) is in a clear bull trend. Recently it appears to have produced a bull trap (failed breakout) which may mark a top. There is no way at this time to know what kind of a top this may be. It may be a short term pullback within an ongoing uptrend or it may be the beginning of something more significant. In any case I think that there is sufficient evidence that a period of consolidation or decline may be upon us and traders are best waiting for the market to set up for its next big primary move.. After a run this strong it is likely that a lot of back and forth action will ensue as either a top in put in place or a consolidation is produced. I think an immediate, strong move in either direction is not likely. A setup may take several weeks to several months to emerge. A break or support at the green primary uptrend would be a major market event. The recent breakdown in commodities may be a precursor to the failure of the equities markets or else a significant divergence.
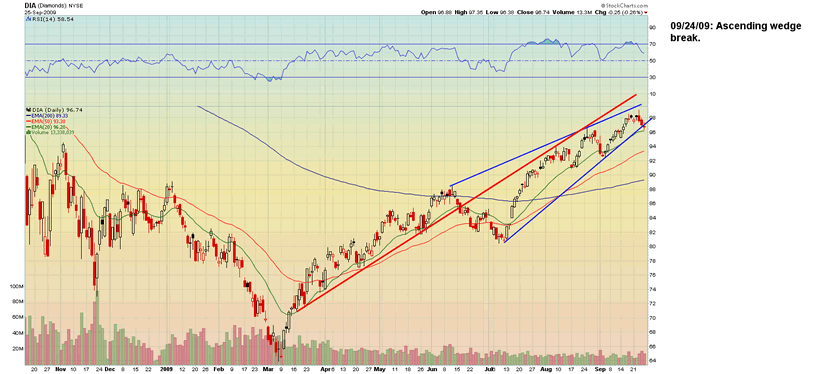
The Dow Industrials, like the SPX, is testing the lower rail of its rising wedge.
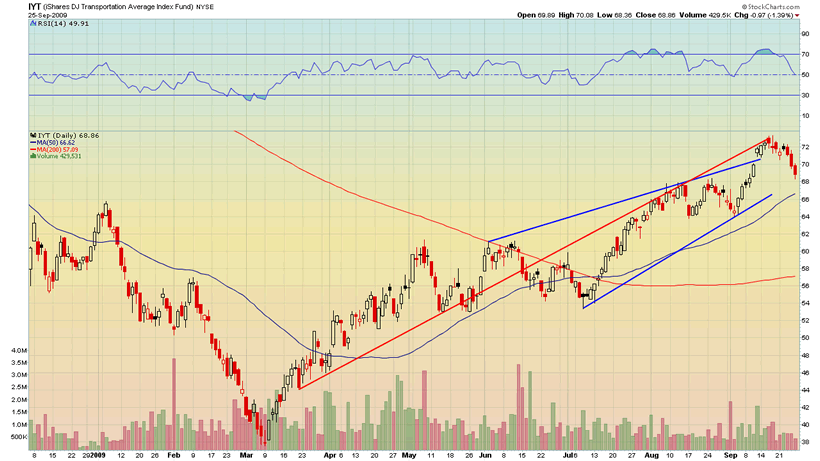
The Dow Transports (IYT) began its downturn well in advance of the rest of the market, which may be a bearish indication.
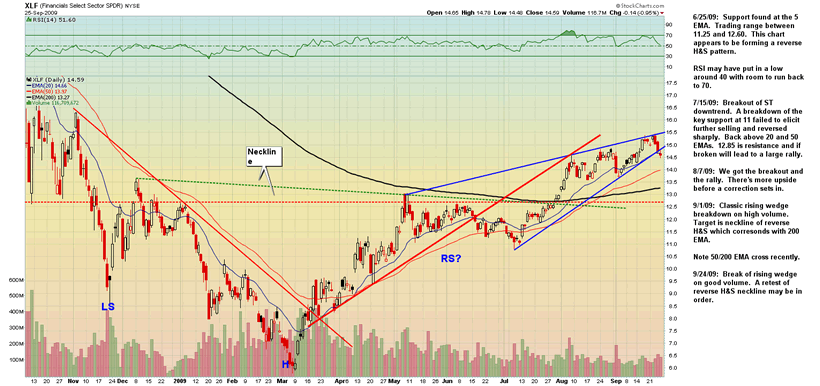
The Financial stocks (XLF) has already broken its rising wedge to the downside.
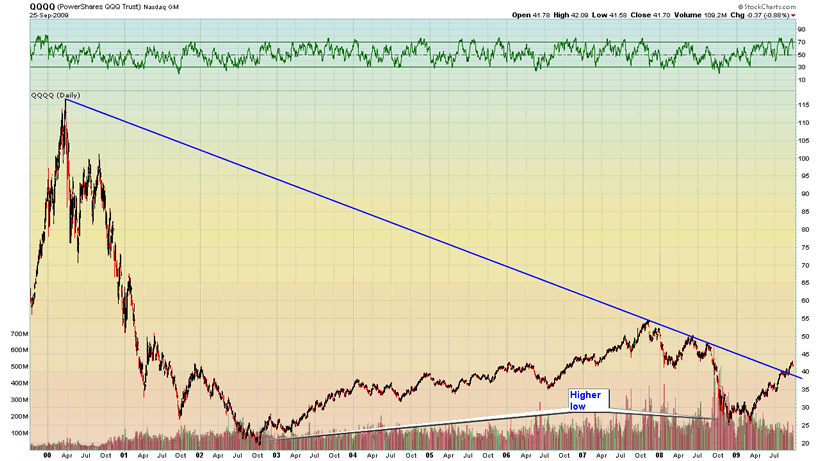
The Nasdaq 100 (QQQQ) has broken its 9 year bear downtrend. Will it now retest the breakout? Will the retest be successful?
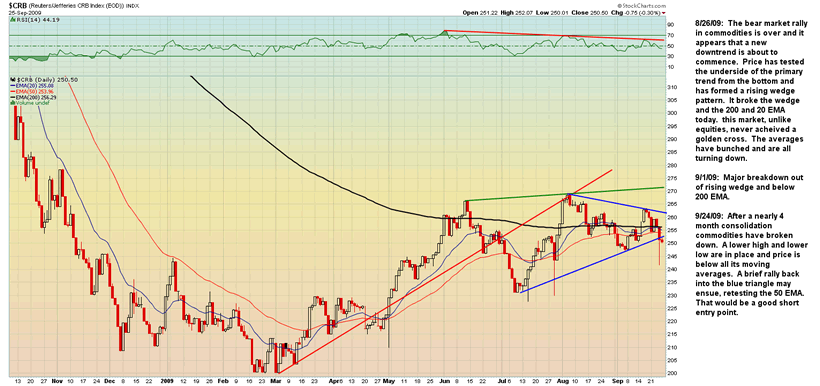
The CRB Commodities Index has gone less than nowhere in the last 4 months, has made a lower high and has broken down from a consolidation triangle. All of its moving averages are turing down and price is trading below them. If the Inflationist view were valid wouldn't we be seeing commodity prices in a clear uptrend.
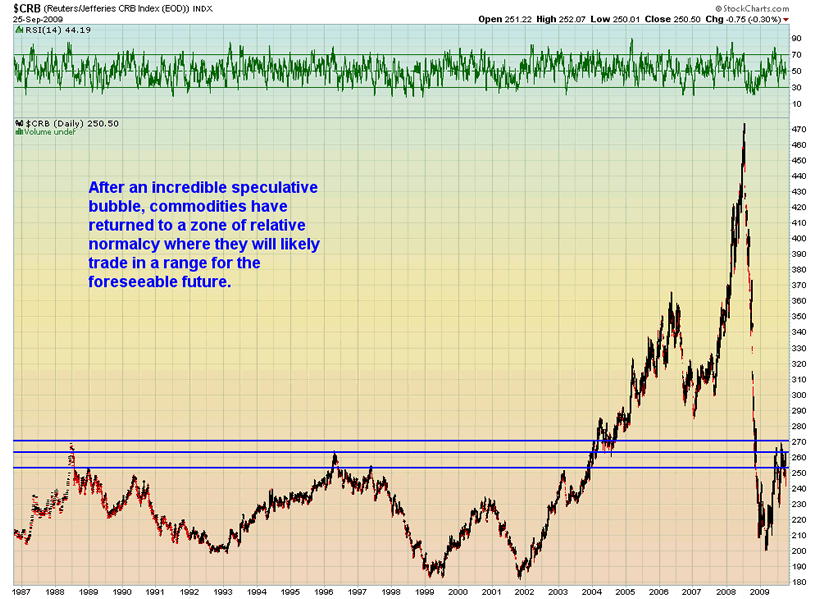
Historical resistance has been strong. Is this really a market that is likely to sustain a rise? The "asset-ization" of commodities turned them from raw economic inputs into yet another speculative plaything.
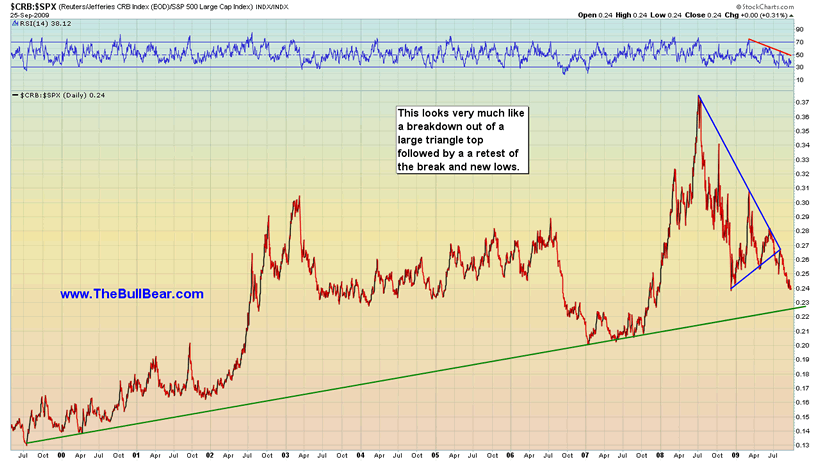
The CRB:SPX ratio is heading for long term support fast. What happens when it gets there may be very telling. If inflation is in the pipeline why are commodities in a downtrend vis-a-vis stocks? Is this signaling deflation?
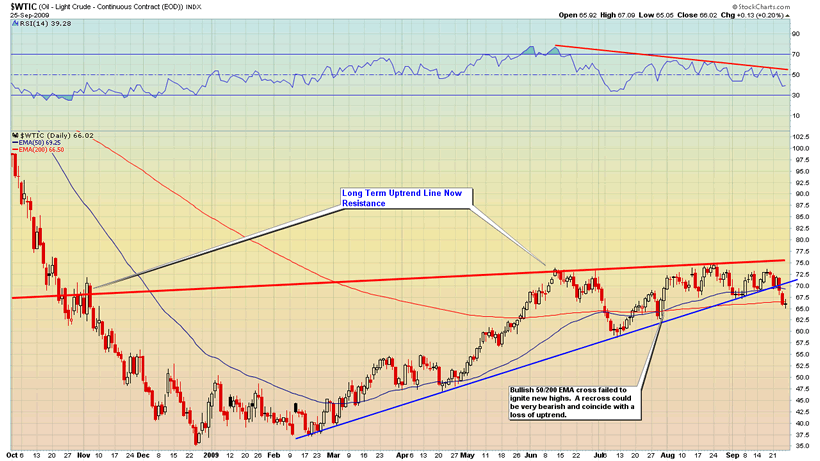
Crude Oil is the most bearishly aligned market that I am aware of at this point. Signs of a clear topping formation are present. Price has violated trend and closed below it on a weekly basis. Long term support has turned into resisitance. We have two lower highs and a lower low and price is trading below both its 50 and 200 EMA. A golden cross failed to produce a higher high which is a very bearish negative divergence. A retest of the break or the 50 EMA in the $70 area may provide a good short entry point. The structure of this top and the length of time it took to form make it less likely that it is a bear trap.
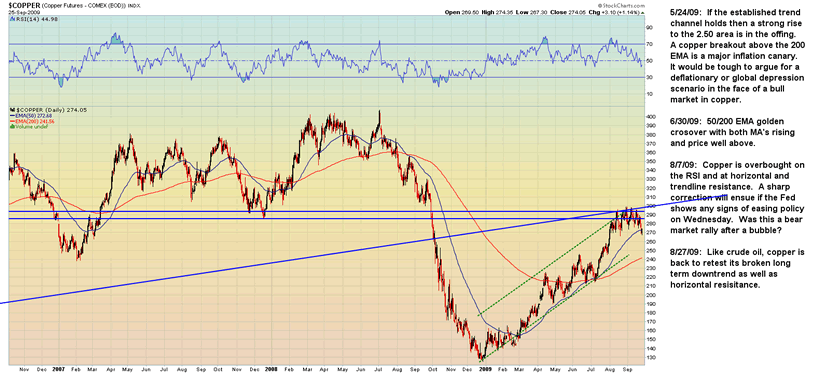
Copper has also broken down out of a lengthy consolidation after failing at long term resistance levels.
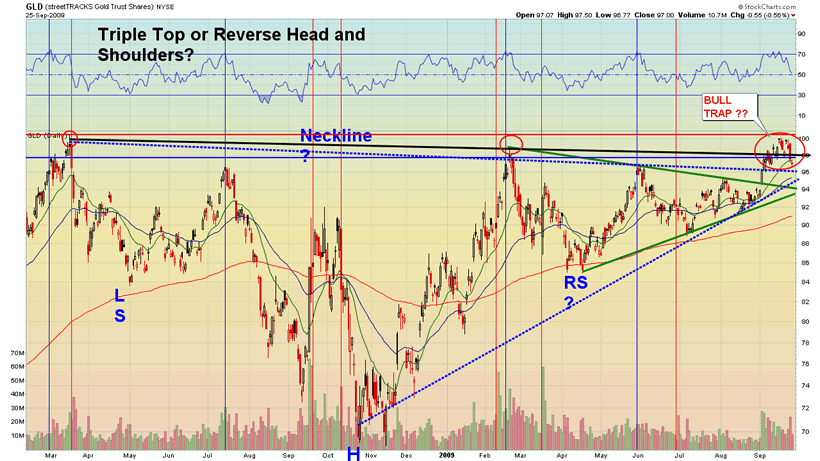
Precious metals investors need to be aware that the technical scenario on gold as well as the broader market context makes the probability very high for a nasty reversal from a bull trap here. A failure back through the apex of the blue or green triangles will likely end the bull market in precious metals. Support at GLD 94 must hold. A break above 100 will initiate a new impulse leg higher.
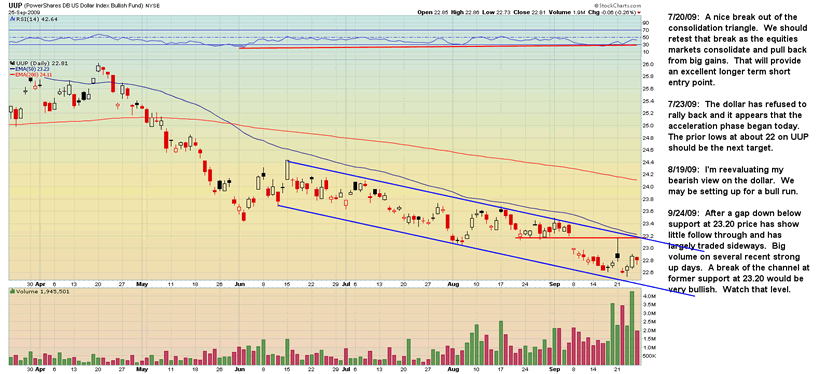
After a gap down below support at $23.20 the US Dollar ETF (UUP) has shown little follow through selling and has largely traded sideways. Volume on up days has swamped volume on down days. A break of the channel at $23.20 would be very bullish.
In a 5 1/2 year period the US Dollar Index has lost just 18% or 3.3% annually. The chart is largely a lateral consolidation with a downside bias. This would seem to be at odds with the view that the dollar has been crashing. The potential for a long term Head and Shoulders reversal pattern exists and the second half of the right shoulder could be formed during any decline in stocks and commodities in the coming weeks. A breakout above the neckline would likely have to be a result of demand from renewed economic growth and strong international trade.
Let's look at the components of the US dollar index on a long term basis. We find that almost every currency in that index is at key very long term resistance levels. We do find that each component, save the GBP, is besting its 50 MEMA.
The Euro clearly ended its uptrend from its lows in 2000 and is right now retesting the break of the uptrend from below and potentially putting in a lower high.
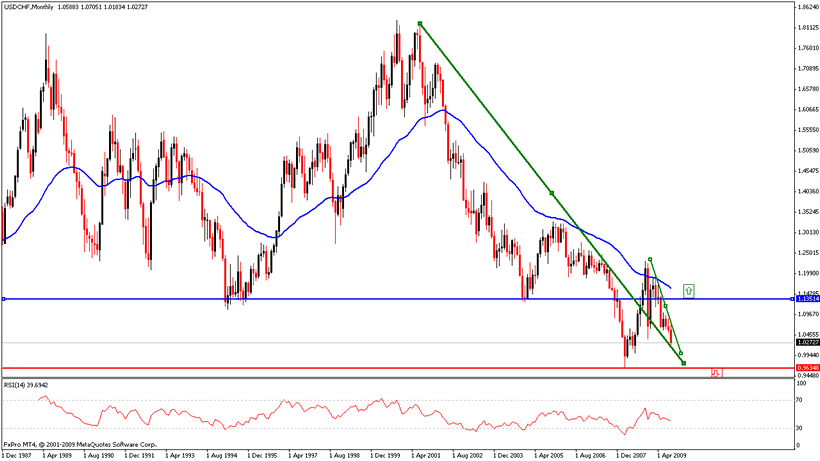
The Dollar broke out against the Swiss Franc and is now retesting the breakout and potentially putting in a higher low.
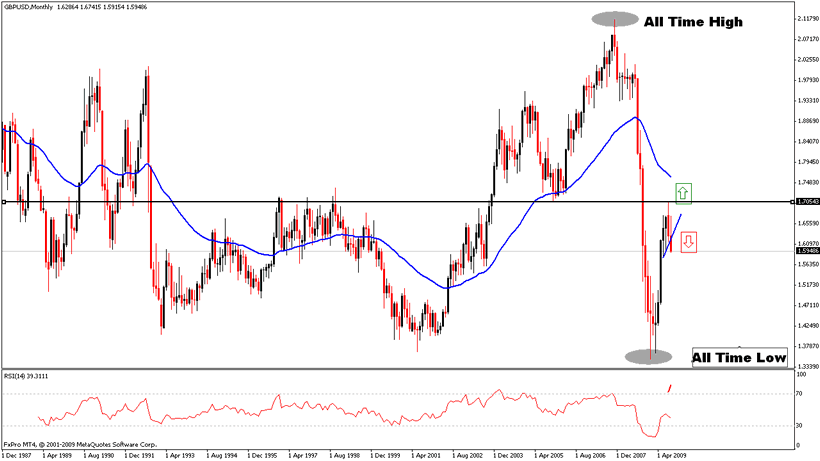
The British Pound crashed from an all-time high against the dollar to an all-time low and then retested its key pivot level at $1.70 recently. That retest has failed badly and the recovery uptrend has been violated decisively. Is the GBP leading the rest of the currencies down against the Dollar?
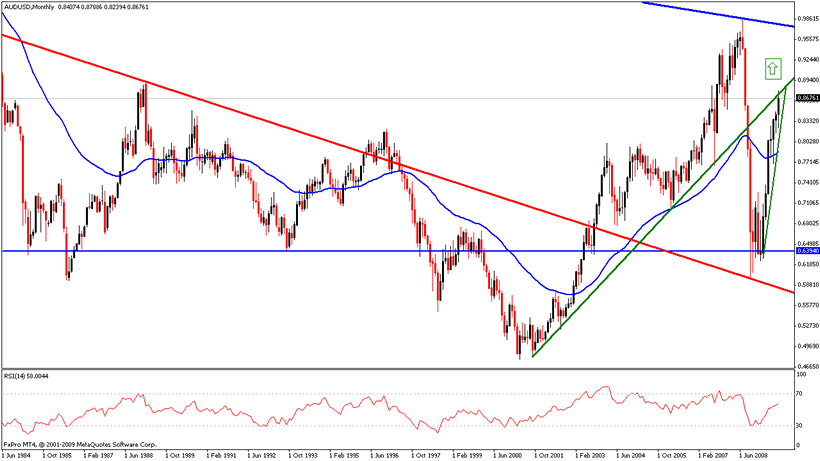
The Austrailan dollar is both a commodity currency as well as an interest rate play. Australia relies upon commodity exports and its Central Bank is anticipated to be the first to raise interest rates. But if commodities are in a bear market what happens to trades based on those assumptions? Like the Euro and the Franc, the Aussie Dollar has broken its long term uptrend and is right now retesting that break from below. Will it be able to take out that resistance absent surging commodity prices?
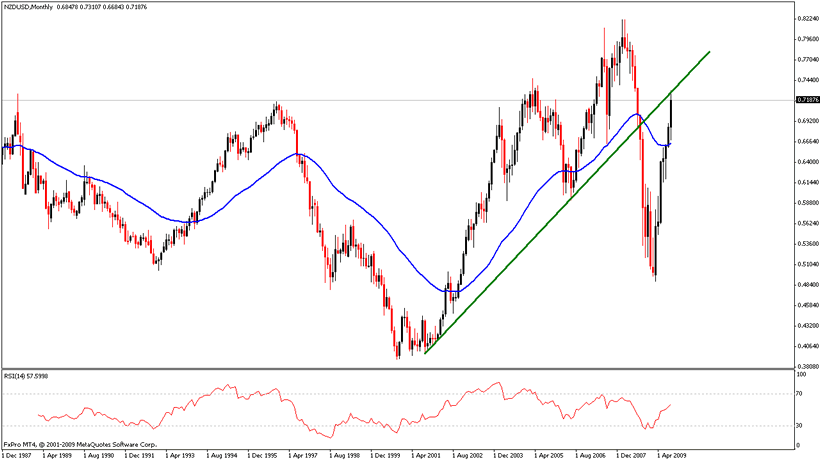
Everything said for the AUD applies to the New Zealand currency as well.
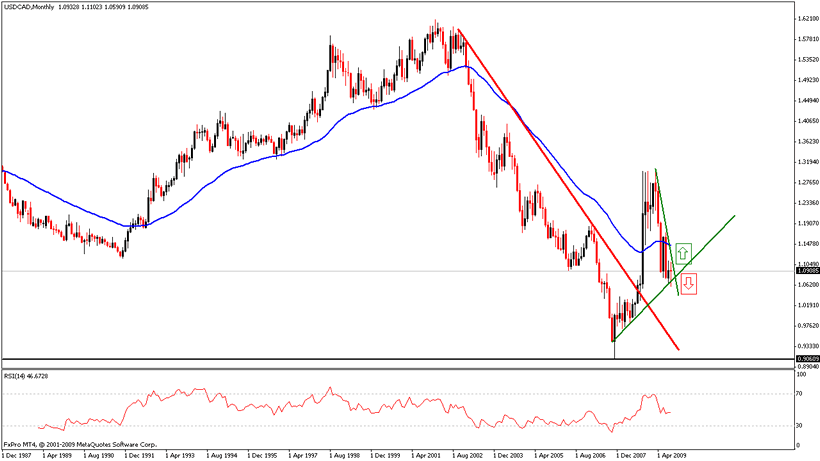
The Canadian Dollar is perhaps the most pure commodity currency play since it is not also viewed as an interest rate play. The dollar rallied sharply against the Loonie and appears to have established an uptrend. Unlike the other currencies in the US Dollar Index it has not come even close to retesting its trend break. Is that a reflection on the future direction of the commodities markets?
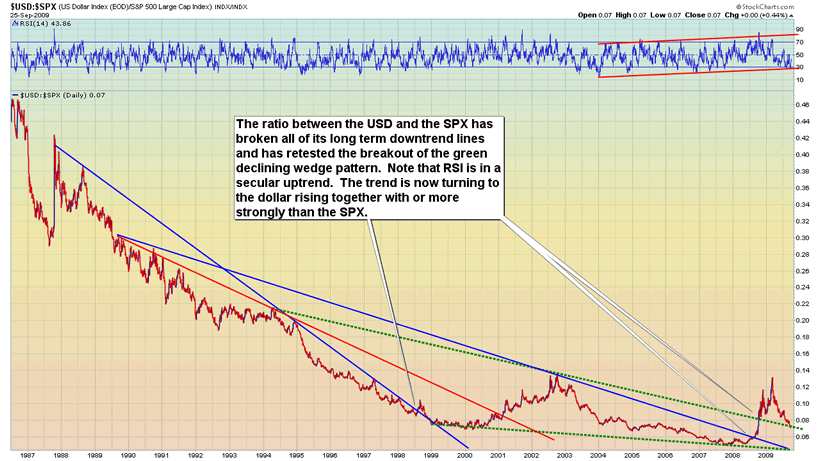
In correlation with the data on commodities and the US Dollar Index we can see that the USD:SPX ratio is also retesting the breakout of a long term bottoming pattern.
CONCLUSION
There are forces of Inflation, Deflation and Growth all acting upon the markets and economies of the world simultaneously. The result may a mix of effects that do not reflect the anticipations of any of these schools of thought.. We may see asset price inflation, commodity price deflation and explosive economic growth in new technologies and moderate growth in some sectors while other sectors continue in recession. In any case, the potential for some result short of total catastrophe is real. As I have said in previous editions of BBMR, the effect of massive Keynesian monetary and fiscal inflation is not the stable, consistent movement of markets in a single direction but greater and greater volatility in markets. Volatility is the new normal and we can expect to see ongoing massive swings in all markets until sound monetary policy is restored to the world (which is to say, probably never). Such are the fruits of Financialism.
There is insufficient data at this time to draw any conclusions about the future of equity prices. It's a bull market until it isn't. Traders in stocks should wait until a new setup--whether bullish or bearish--emerges.
Evidence is mounting that something big is about to happen in the US Dollar and commodities. The correspondence between the charts of the US Dollar Index and the individual charts of its components as well as the USD:SPX and the CRB and CRB:SPX tends to suggest that a contrarian play may be at hand. On the other hand, a pullback in commodities and a rally in the Dollar may be mere respites before commodities penetrate resistance and the Dollar plunges to its former lows and beyond. If you are short the Dollar and long commodities you may want to re-evaluate your position and tighten up your stops. As yet this setup remains in the realm of the potential but traders should be attuned to the possibilities and ready to act if and when that potential matures.
If you benefitted from this installment of The BullBear Market Report please consider making a DONATION.
Subscribe to my free BullBear Trading Service to get all the details of my trades as they develop.
By Steve Vincent
The BullBear Market Report is live every Monday and Thursday after the closing bell. Call in with your questions, thoughts and observations.
Disclosure: No current positions.
© 2009 Copyright Steven Vincent - All Rights Reserved Disclaimer: The above is a matter of opinion provided for general information purposes only and is not intended as investment advice. Information and analysis above are derived from sources and utilising methods believed to be reliable, but we cannot accept responsibility for any losses you may incur as a result of this analysis. Individuals should consult with their personal financial advisors.
© 2005-2022 http://www.MarketOracle.co.uk - The Market Oracle is a FREE Daily Financial Markets Analysis & Forecasting online publication.