


Stock Market Major Downtrend Awaits Confirmation of Top
Stock-Markets / Stock Index Trading Sep 27, 2009 - 06:35 PM GMTBy: Andre_Gratian

 Current Position of the Market
SPX: Long-term trend - Down! The very-long-term cycles have taken over and if they make their lows when expected, the bear market which started in October 2007 should continue until 2014. This would imply that much lower prices lie ahead. This will not be a straight-down decline, but a series of intermediate-term rallies and declines until we have reached the low point.
SPX: Intermediate trend - Near reversing! The intermediate move which started in March is coming to an end. But we will need confirmation by trading below the main trend line which is currently just a little above 1000.
Analysis of the short-term trend is done on a daily basis with the help of hourly charts. It is an important adjunct to the analysis of daily and weekly charts which determines the course of longer market trends.
Daily market analysis of the short term trend is reserved for subscribers. If you would like to sign up for a FREE 4-week trial period of daily comments, please let me know at ajg@cybertrails.com .
Overview:
Last Wednesday, we saw the indices reverse sharply after touching our 1080-85 projection. By Friday, prices were still declining, but found some support on a secondary uptrend line and held above it until the close. Before we can claim to have made an important reversal, we will need to break that trend line and move lower to challenge the primary uptrend line which ran at about 1002 as of Friday's close.
For some time I have warned that the longer-term cycles were nearly ready to turn down once again. Perhaps they finally have. We'll need to confirm this by seeing the SPX breaking significant trend lines and support levels. Several Elliott Wave theorists have been looking for the top of primary wave 2 and the beginning of primary wave 3. Elliott Wave International is one of them, expecting a sudden decline to new lows once it has. Others have a somewhat different count, but with the same results: the beginning of a sharp decline which will lead to new market lows.
Although we may have started a good correction, I will not be convinced that we have made the final high of the move from the March lows until we get some solid confirmation. At the very least, this would include breaking the main uptrend line of the wedge formation. The reason that I need more confirmation is that there are conditions that I look for at important highs that are missing. One of them is relative weakness in the NDX. This is clearly not the case right now. The other is that we did not have enough of a negative reading on my preferred sentiment indicator. I do not know for certain that these are absolute requirements for an intermediate top, but it's enough to warn me to wait a little longer before deciding on a trend change.
There are several possible scenarios at this juncture. One of them is needing to make one more wave to new highs before we finish the move from 667. Next week will bring more clarity. Let's analyze the charts.
What's ahead?
Chart Pattern and Momentum
On the weekly chart, the SPX met resistance at an internal trend line which parallels the primary trend line, and from the top trend line of its wedge which it penetrated slightly last week. The price closed above the pink MA and well above the green trend line. There is some negative divergence continuing to show in the histogram and the lower indicator just nicked its uptrend line. It's the picture of an uptrend which is in the process of an unconfirmed reversal.
The daily chart (below) shows the resistance which the index was facing when it met its projection target at 1080 (pink horizontal line). There was the wedge upper trend line (red), the extension of a former trend line (dashes). At that level, it also met an important internal trend line (dashes) which is a parallel to the primary downtrend line.
Note that the second leg (C) of the larger wave pattern is itself a smaller wedge, and that the current decline has come to rest on the lower trend line of that wedge.
When the index met its target and the trend lines' resistance, negative divergence was appearing in all three indicators, an ideal set-up for a reversal to take place.
Breaking the secondary trend line on which the SPX is currently resting will bring a challenge to the main trend line and to the 50 DMA (blue). If this happens, the MACD -- which has been losing upside momentum little by little for several weeks -- will be in a position to challenge its uptrend line which is now almost a year long. A violation of that trend line would be bearish.
The hourly chart,(above) shows an index which is ready to move up. Two of the oscillators have already turned up and it's only a matter of the price breaking above the pink moving average and the trend line. Whether it does or not is, in part, a matter of when the 30-day cycle will make its low. The green asterisk-- which is placed on Monday -- is probably the ideal time for it to do so, but the green line represents the range that its phase has had in the past, so it may have bottomed on Friday, or may not do so until next Wednesday.
If the trend line holds, the combined push of the up-cycle plus the end of quarter window dressing could start a new uptrend. How much strength develops in this uptrend will determine what kind of a top was made at 1080.
Cycles
From the last newsletter: "The longer-term cycles which had been expected to roll over in early August have been delayed, helped by a rash of good economic reports. Nevertheless, it's only a matter of time before they turn. Perhaps another two or three weeks." Longer cycles require a longer time period to confirm that they have turned. I have already discussed what would be required for confirmation. If they have, we could be facing a decline which would last well into 2010.
The 22-wk cycle is ideally due to make its low on about 10/13 -- if it does not invert, as it did at the end of its last phase. There are 5 minor cycles which are due to bottom between now and then. With that kind of pressure directly ahead, it would seem logical that the decline, after a bounce off its trend line, would continue into that time frame.
Other cycles suggest a low toward the end of October.
Projections:
With the 1080-1085 projection met, we got the normal reversal which accompanies filled targets. The first downward projection of 1046 has been met and surpassed.
If the secondary trend line is broken and the index goes below the 1035 level, we can expect the next immediate objective to be about 1010.
If a bounce off the trend line takes the index past 1053, it could continue to about 1060 before turning down again; beyond 1060 with good A/D support would suggest a potential test of the highs.
Breadth
The NYSE Summation index (courtesy of StockCharts) does not show much divergence to the SPX, but its RSI is now showing important negative divergence to the SI itself. This is bearish and indicates topping action.
The daily A/D index has already given a sell signal, but the hourly is back in an uptrend, and could signal a coming bounce.
Market Leaders and Sentiment
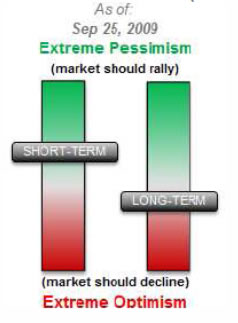
The sentiment indicator (courtesy of Sentimentrader) is near neutral on a long-term basis and somewhat Bullish, short-term. This is normally not an indication that we are ready for an intermediate decline, but it suggests that a short-term rally may be due.
The relative strength index of SPX/NDX (courtesy StockCharts) is mixed and not particularly bearish.
Summary
From the last newsletter: "When it gets underway, the decline is expected to continue well into 2010. We are not quite there yet, but I would expect that by the next newsletter, things will look a little different -- and we will be much closer to reversing!" Things are indeed looking a "little" different, but not much, and although we have started a decline, there is still no confirmation that we have made an important top. Confirmation would entail breaking below the primary uptrend line which currently runs a little above 1000.
The following are examples of unsolicited subscriber comments:
Awesome calls on the market lately. Thank you. D M
Your daily updates have taken my trading to the next level. D
… your service has been invaluable! It's like having a good technical analyst helping me in my trading. SH
I appreciate your spot on work more than you know! M
But don't take their word for it! Find out for yourself with a FREE 4-week trial. Send an email to ajg@cybertrails.com .
By Andre Gratian
MarketTurningPoints.com
A market advisory service should be evaluated on the basis of its forecasting accuracy and cost. At $25.00 per month, this service is probably the best all-around value. Two areas of analysis that are unmatched anywhere else -- cycles (from 2.5-wk to 18-years and longer) and accurate, coordinated Point & Figure and Fibonacci projections -- are combined with other methodologies to bring you weekly reports and frequent daily updates.
“By the Law of Periodical Repetition, everything which has happened once must happen again, and again, and again -- and not capriciously, but at regular periods, and each thing in its own period, not another’s, and each obeying its own law … The same Nature which delights in periodical repetition in the sky is the Nature which orders the affairs of the earth. Let us not underrate the value of that hint.” -- Mark Twain
You may also want to visit the Market Turning Points website to familiarize yourself with my philosophy and strategy.www.marketurningpoints.com
Disclaimer - The above comments about the financial markets are based purely on what I consider to be sound technical analysis principles uncompromised by fundamental considerations. They represent my own opinion and are not meant to be construed as trading or investment advice, but are offered as an analytical point of view which might be of interest to those who follow stock market cycles and technical analysis.
Andre Gratian Archive |
© 2005-2022 http://www.MarketOracle.co.uk - The Market Oracle is a FREE Daily Financial Markets Analysis & Forecasting online publication.