How to Make a Million Trading Financial Markets Using Trendlines
InvestorEducation / Learn to Trade Sep 24, 2009 - 04:06 PM GMTBy: EWI
 Today more and more investors are warming to the fact that psychology moves markets and therefore fundamental analysis, which fails to properly measure mass investor psychology, must be flawed.
Who can blame them? After all, fundamental analysis -- based on past company earnings, rating agency projections and the like -- proved to be of little value during the bust.
There is a better way.
Many investors who monitor investor sentiment readings, study Elliott wave patterns and employ other powerful technical indicators were -- at very least -- able to position themselves to survive the recent decline. Still others were able to turn crisis into opportunity and profit from the volatility.
How'd they do it?
Technical analysis.
You see, technical indicators remove the cloudy, bias-driven assumptions from your analysis and focus on the one thing that moves markets: investor psychology.
Past performance is not indicative of future results -- and that's where fundamental analysis goes wrong. It fails to factor in the psychology that not only moves markets up and down but also leads analysts to extrapolate the current or past trend into the future. That's why fundamental analysts almost always miss major tops and bottoms.
Our friends over at Elliott Wave International employ the largest team of technical analysts in the world. They recognize that optimism peaks before market tops and pessimism troughs before market bottoms. They use powerful and sometimes unconventional tools to help identify psychological extremes that signal high-probability turning points.
EWI's brand-new 50-page eBook, The Ultimate Technical Analysis Handbook, will show you the various methods of technical analysis they use every day and teach you how to use these powerful tools for yourself.
If you're a technician, this eBook is perfect for you. If you're a fundamentals follower, it's more important than ever that you give technical analysis a closer look. Even if you never completely abandoned your fundamental indicators, you WILL benefit from drawing on these valuable technical tools.
How a Kid With a Ruler Can Make a Million - A Lesson in Drawing and Using Trendlines
The following article is adapted from a brand-new 50-page ebook from Elliott Wave International. Learn more about The Ultimate Technical Analysis Handbook, and download your free copy here.
By Jeffrey Kennedy
When I began my career as an analyst, I was lucky enough to have some time with a few old pros.
One in particular that I will always remember told me that a kid with a ruler could make a million dollars in the markets. He was talking about trendlines. I was sold.
I spent nearly three years drawing trendlines and all sorts of geometric shapes on price charts. And you know, that grizzled old trader was only half right.
Trendlines are one the most simple and dynamic tools an analyst can employ... but I have yet to make my million dollars, so he was wrong -- or at least early -- on that point.
Despite being extremely useful, trendlines are often overlooked. I guess it’s just human nature to discard the simple in favor of the complicated.
(Heaven knows, if they don’t understand it, it must work, right?)

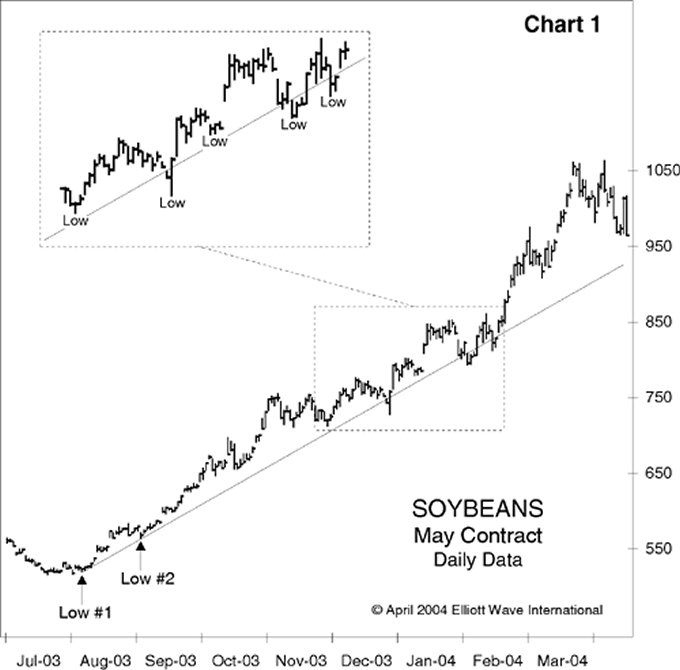
In the chart above, I have drawn a trendline using two lows that occurred in early August and September of 2003.
As you can see, each time prices approached this line, they reversed course and advanced.
Sometimes, soybeans only fell to near this line before turning up.
Other times, prices broke through momentarily before resuming the larger uptrend.
What still amazes me is that two seemingly insignificant lows in 2002 pointed the direction of soybeans -- and identified several potential buying opportunities -- for the next six months!
Get more lessons like the one above in the free 50-page Ultimate Technical Analysis Handbook. Learn more and download your free copy here.
Jeffrey Kennedy is the Chief Commodity Analyst at Elliott Wave International (EWI). With more than 15 years of experience as a technical analyst, he writes and edits Futures Junctures, EWI's premier commodity forecasting service.
© 2005-2022 http://www.MarketOracle.co.uk - The Market Oracle is a FREE Daily Financial Markets Analysis & Forecasting online publication.


