


The Relative Performance Derby And Other Evils Of Modern Investment
InvestorEducation / Risk Analysis Jun 25, 2007 - 10:14 PM GMTBy: John_Mauldin
 This week in Outside the Box we take a gander at the always-insightful research of good friend James Montier, who poignantly addresses the pertinent topic of portfolio diversification and the pitfalls that ensue on account of benchmarking, wherein investors obsess over relative performance and their respective tracking error. James asks the question, why does the average US mutual fund hold 160 stocks, when diversification could be achieved with around 30-40 stocks. The answer in word, benchmarking.
James Montier posits that the average portfolio manager is focused upon short-term relative performance, paying scant attention to total portfolio risk, rather, the inclination of the average PM is to be primarily concerned with tracking error, that being stock specific or idiosyncratic risk. This misguided focus Montier suggests, leads the PM to manage very large portfolios in their attempt to control stock specific risk, holding nearly 4 times the number of stocks needed to meet diversification targets.
The solution you may ask? Montier suggests the utilization of Monte Carlo simulation to construct a universe of potential portfolios subject to construction rules that define your respective investing universe, thus permitting the measurement of skill to a comparable universe and impelling the manager to focus on absolute return performance.
John Mauldin, Editor
This week in Outside the Box we take a gander at the always-insightful research of good friend James Montier, who poignantly addresses the pertinent topic of portfolio diversification and the pitfalls that ensue on account of benchmarking, wherein investors obsess over relative performance and their respective tracking error. James asks the question, why does the average US mutual fund hold 160 stocks, when diversification could be achieved with around 30-40 stocks. The answer in word, benchmarking.
James Montier posits that the average portfolio manager is focused upon short-term relative performance, paying scant attention to total portfolio risk, rather, the inclination of the average PM is to be primarily concerned with tracking error, that being stock specific or idiosyncratic risk. This misguided focus Montier suggests, leads the PM to manage very large portfolios in their attempt to control stock specific risk, holding nearly 4 times the number of stocks needed to meet diversification targets.
The solution you may ask? Montier suggests the utilization of Monte Carlo simulation to construct a universe of potential portfolios subject to construction rules that define your respective investing universe, thus permitting the measurement of skill to a comparable universe and impelling the manager to focus on absolute return performance.
John Mauldin, Editor
The Relative Performance Derby And Other Evils Of Modern Investment
![]()
31 May 2007 -
Global Equity Strategy -
by James Montier
Why does the average US mutual fund hold 160 stocks? The usual answer is that this is required for diversification purposes. Now I am not a fan of the use of standard deviation and variance to describe risk (see Global Equity Strategy , 1 February 2007 for more on this). To me it simply doesn't capture the way we think about risk at all. However, once in a while I am forced to use the metrics of classical finance to show the madness of behaviour. This is one such occasion.
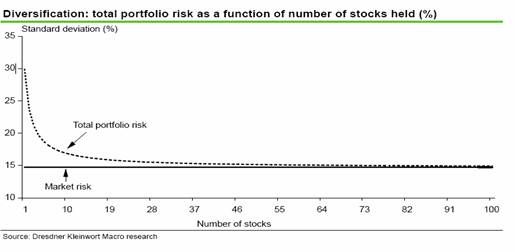
The idea that you need 160 stocks to diversify is simply ludicrous. The chart below shows diversification benefits can largely be achieved with 30-40 stock portfolios. That is to say, you can have a return profile with roughly the same volatility as the overall equity market by holding around 30-40 stocks. In order to create this chart we have used US data for the last twenty years, and we are assuming equal weighting.
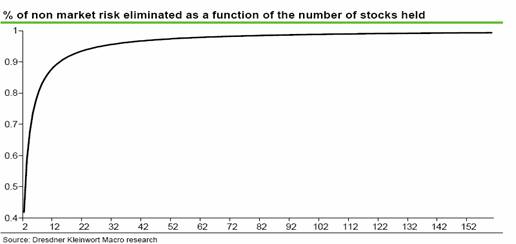
An alternative perspective is provided by showing the percentage of non-market risk that is eliminated as the number of stocks in the portfolio increases. This is shown in the chart below. Holding two stocks eliminates around 42% of the risk of owning just one stock, holding four stocks this is reduced by 68%, by 83% by holding 8 stocks, by 91% by holding 16 stocks, by 96% by holding 32 stocks. This relationship is graphed in the chart below.
Now, none of this is rocket science, so why does the average US mutual fund choose to hold nearly 4 times the number of stocks it needs to hold in order to meet diversification targets?
The answer is, of course, that the average portfolio manager isn't concerned with total risk, but rather with risk measured relative to a performance benchmark (the index). This is a direct effect of what Seth Klarman 1 so eloquently calls the 'short-term relative performance derby' that is fund management today.
Klarman describes most institutional investors as 'Like dogs chasing their own tails" , he continues "It is understandably difficult to maintain a long-term view when, faced with the penalties for poor short-term performance, the long-term view may well be from the unemployment line". That said, he believes "There is ample blame" for fund managers, consultants and end clients to share between them.
Klarman opines "There are no winners in the short-term, relative performance derby. Attempting to outperform the market in the short-term is futile... The effort only distracts a money manager from finding and acting on sound long-term opportunities... As a result, the clients experience mediocre performance... Only brokers benefit from the high level of activity."
ather than worrying over absolute returns, the majority of professional investors while away their hours sweating over relative performance. To them, it isn't the total portfolio risk that matters, it is tracking error and thus it is stock specific or idiosyncratic risk that matters most to such investors.
Stock-specific risk was the subject of the very first Global Equity Strategy we published ( Global Equity Strategy , 31 May 2002). We documented a massive rise in stock specific risk over the bubble years. As the bubble burst so stock specific risk has receded back towards 'normal' levels once more 2 .
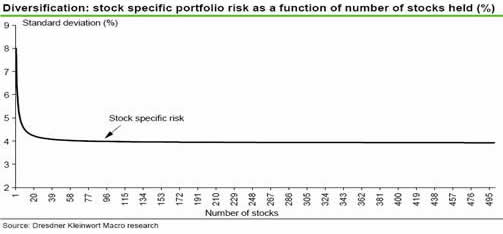
Despite this decline in stock specific risk, it remains a stubborn problem for a benchmark obsessed investor. The chart below shows the diversification picture for stock-specific risk, again using data from the last 20 years for the US market.
In the previous charts total risk converged asymptotically towards market risk. In an ideal world stock specific risk would decline towards zero in the same fashion. However, that isn't the case; stock specific risk remains significant even at very large numbers of stocks.
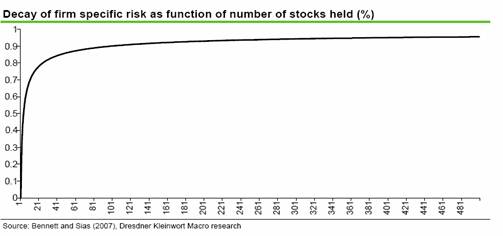
So, as much as benchmark obsessed investors would like to avoid stock specific risk, they can't. Just as I started writing this note, a new paper by Bennett and Sias landed on my desk 3 . Given the subject matter I was working on, the timing couldn't have been better. They find a very similar result to the one above.
In addition they provide some nifty mathematics for exploring the role of stock specific risk. For instance, they show that the expected fraction of a single stock's firm specific risk eliminated by holding an N asset portfolio is 1 -1/sqrt(N). This implies that relatively small portfolios eliminate stock specific risk relatively fast. For instance a 30 stock portfolio eliminates around 82% of the stock specific risk of the average security. This rises to around 92% for a 160 stock portfolio.
However, Bennett and Sias point out that although this decay is relatively fast, the remaining stock specific risk is non-negligible. They report an estimate of the expected standard deviation of stock specific returns for a randomly selected N-asset portfolio 4 . For example as mentioned above, a 30 stock portfolio eliminates 82% of the stock specific risk. However, the expected standard deviation of the remaining stock-specific risk is still around 12% p.a.
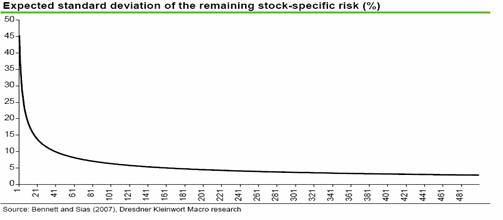
Even a 160 stock portfolio has an expected standard deviation of stock-specific risk of around 5%p.a. - not far off the ex post equity risk premium!
An alternative to benchmarking
Given my derisive attitude toward benchmark investing, I am always on the look out for an alternative to help offset the problems. I recently stumbled upon an idea that may help us break free from the slavish following of an arbitrary benchmark.
One of the major problems of performance evaluation is that one needs exceptionally long sample periods before it is even vaguely possible to distinguish luck from skill. For instance, for a top quartile US equity fund manager with an information ratio of 0.5, it would take 13 years worth of data to be 95% sure that you would see a positive performance. Whilst I constantly exhort that a focus on the long-term is key, I know that such time horizons are an anathema to almost all investors.
However, Ron Surz 5 has come up with an idea that may help bridge the gap between those who want measurement and those who want to break away from the tyranny of the benchmark. Surz suggests we use Monte Carlo simulation to construct a universe of potential portfolios subject to the portfolio construction rules that define your investing universe (he calls these portfolio opportunity distributions or PODs 6 ). These PODs can then be graphed to show where in the distribution of likely outcomes a manager sits.
This idea harnesses the power of the cross section. We no longer need decades of data to see if a manager has skill relative to his own universe (an artificial peer group if you like). The chart below shows the performance of a US manager for whom I have great respect. I've plotted his return information against the S&P500 universe (although he is a value manager, he is large cap). I know this manager holds benchmarks in contempt and runs focused portfolios based on his value ideas.
However, for the measurement junkies, the chart below clearly demonstrates that this manager has marked skill relative to the S&P500 universe. He is in the top quartile of all possible portfolios over the most recent period, and over the long-term seems to show a real edge.
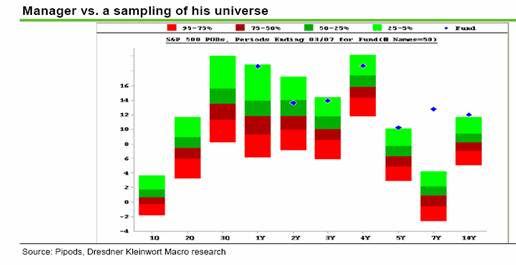
The idea of using Monte Carlo simulation strikes me as potentially very useful. It frees up the fund managers by getting them to concentrate on absolute returns, but allows the measurement junkies a way of seeing if the manager has skill relative to a comparable universe of investors using the same sort of portfolio construction rules.
Footnotes:
1 The Margin of Saftey (1991) Seth Klarman
2 See Why company-specific risk changes over time (2006) Bennett and Sias, Financial Analysts Journal, Vol 62, Number 5
3 Bennett and Sias (2007) How diversifiable is firm-specific risk? Available from www.ssrn.com
4 This is measured as square root of (1/N) times the time-series variance of firm-specific returns averaged across all individual securities.
5 So for the benchmark driven investor stock-specific risk is simply an ugly fact of life, but then again so is benchmark driven investment itself!
5 Surz (2006) A fresh look at investment performance evaluation: Unifying best practices to improve timeliness and reliability, Journal of Portfolio Management, Summer 2006
6 The PIPODs software is available from http://www.ppca-inc.com
Conclusion
![]()
I hope you found James Montier research thought provoking.
Your absolute return analyst,
By John Mauldin
http://www.investorsinsight.com
To subscribe to John Mauldin's E-Letter please click here: http://www.frontlinethoughts.com/subscribe.asp
Copyright 2007 John Mauldin. All Rights Reserved
John Mauldin is president of Millennium Wave Advisors, LLC, a registered investment advisor. All material presented herein is believed to be reliable but we cannot attest to its accuracy. Investment recommendations may change and readers are urged to check with their investment counselors before making any investment decisions. Opinions expressed in these reports may change without prior notice. John Mauldin and/or the staff at Millennium Wave Advisors, LLC may or may not have investments in any funds cited above. Mauldin can be reached at 800-829-7273.
Disclaimer PAST RESULTS ARE NOT INDICATIVE OF FUTURE RESULTS. THERE IS RISK OF LOSS AS WELL AS THE OPPORTUNITY FOR GAIN WHEN INVESTING IN MANAGED FUNDS. WHEN CONSIDERING ALTERNATIVE INVESTMENTS, INCLUDING HEDGE FUNDS, YOU SHOULD CONSIDER VARIOUS RISKS INCLUDING THE FACT THAT SOME PRODUCTS: OFTEN ENGAGE IN LEVERAGING AND OTHER SPECULATIVE INVESTMENT PRACTICES THAT MAY INCREASE THE RISK OF INVESTMENT LOSS, CAN BE ILLIQUID, ARE NOT REQUIRED TO PROVIDE PERIODIC PRICING OR VALUATION INFORMATION TO INVESTORS, MAY INVOLVE COMPLEX TAX STRUCTURES AND DELAYS IN DISTRIBUTING IMPORTANT TAX INFORMATION, ARE NOT SUBJECT TO THE SAME REGULATORY REQUIREMENTS AS MUTUAL FUNDS, OFTEN CHARGE HIGH FEES, AND IN MANY CASES THE UNDERLYING INVESTMENTS ARE NOT TRANSPARENT AND ARE KNOWN ONLY TO THE INVESTMENT MANAGER.
John Mauldin Archive |
© 2005-2022 http://www.MarketOracle.co.uk - The Market Oracle is a FREE Daily Financial Markets Analysis & Forecasting online publication.