UK House Prices Tracking Claimant Count Rather than Unemployment Numbers
Housing-Market / UK Housing Aug 28, 2009 - 12:18 AM GMTBy: Nadeem_Walayat
 This is the first in a series of analysis as part of an in depth up-date to the UK house price forecast of August 2007 that correctly called a peak in UK house prices and forecast a 2 year bear market that would see UK house prices fall by 15% to 25%. This analysis seeks to compare UK house prices against unemployment data. To ensure that you receive the full final analysis and conclusion / forecast for the UK housing market covering the trend for the next 2-3 years subscribe to my always free newsletter.
UK Unemployment Data
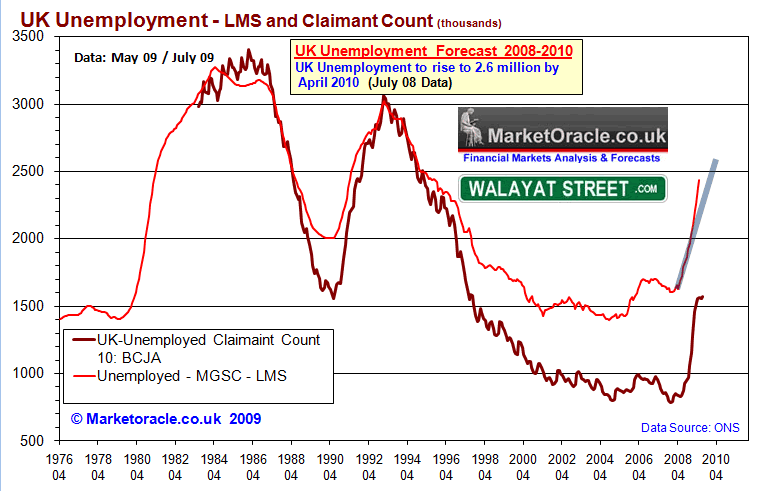
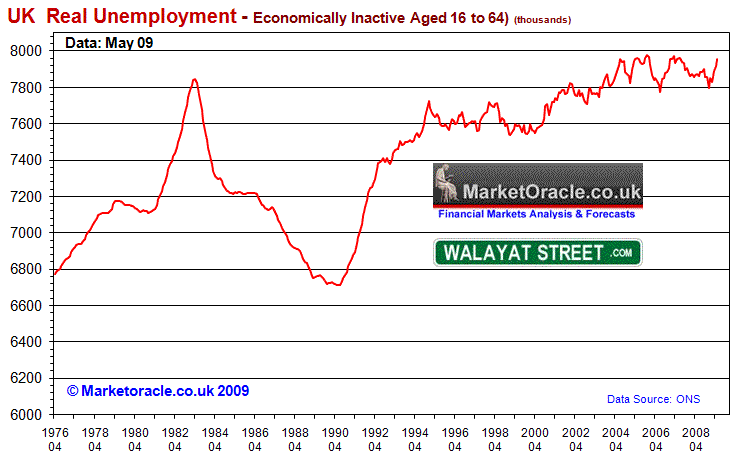
I have long questioned the accuracy and validity of the official unemployment data which over several decades and much manipulation by successive governments has been tweaked many hundreds of time to under report true unemployment for political purposes. Current official unemployment stands at 2.435 million for May data release against which the total are recorded as economically inactive of working age stands at 7.955 million which in my opinion is reflective of the true rate of unemployment as the below graphs illustrate.


Another poignant reminder of the lack of accuracy in the unemployment data is observed in the announcement today that now 1 in 6 house holds have no wage earner, i.e. all adults are unemployed in a total 3.3 million households, which clearly suggests a number of unemployed significantly above the 2.435 million official data of those unemployed.
UK Unemployment Data Forecast
The original forecast of October 2008 (July 08 data) as illustrated by the below graph, forecast UK unemployment to hit 2.6 million by April 2010. The actual data to date of 2.43 million to May 2009 clearly continues to suggest a much higher peak which remains on track to hit 3 million, as unemployment tends to lag economic recoveries by anywhere from between 6 to 12 months.
UK House Prices Against Unemployment Trend Analysis

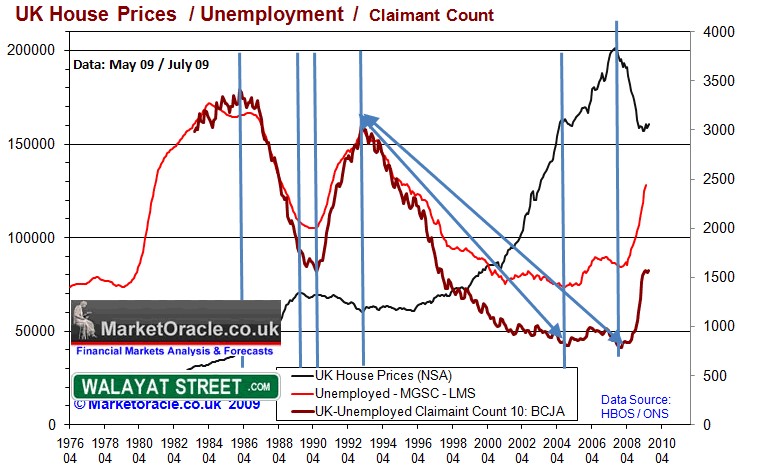
The above chart indicates that there does exist a strong relationship between house price trends and the unemployment benefit claimant count, more so than the unemployment data. The possible reason for this is that those made unemployed that do not claim benefits are not in as financially distressed state than those that have no choice but to claim benefits, therefore house prices can and have risen in the past whilst the official rate of unemployment rose, if at the same time the claimant count did not rise.
The recent bounce in house prices is tracking quite closely with the stabilisation of the unemployment claimant count numbers, which therefore suggests that as long as those claiming unemployment benefits continues to stabilise at the current level of 1.6 million then the outlook remains positive for UK house prices to continue drifting higher, this is despite official unemployment data that looks set to continue to rise towards 3 million from 2.43 million.
Existing UK House Prices Analysis and Forecast
As mentioned earlier the original forecast of August 2007 concluded with a forecast drop in UK house prices of between 15% and 25% by August 2009, which has materialised.
August 2007 Forecast Conclusion - The UK Housing market is expected to decline by at least 15% during the next 2 years. Despite the 2012 Olympics, London is expected to fall as much as 25%. UK Interest rates are either at or very near a peak, as there is an increasingly diminishing chance of a further rise in October 2007. After which UK interest rates should be cut as the UK housing market declines targeting a rate of 5% during the second half of 2008. The implications for this are that the UK economy is heading for sharply lower growth for 2008.
This has been supported by over a hundred pieces of analysis on the UK housing market with several warnings not to pay any attention to the vested interest as they continued to remain in denial right upto the summer of 2008 with announcements such as that of a soft landing or that house prices would not fall, as Sept 07's article illustrated - UK Housing Market on Brink of Price Crash - Media Lessons from 1989!
UK Housing Market 2008 Crash Trigger - Following the peak in UK house prices, the initial trend was inline with the original forecast, however it was recognised following Northern Rocks bust that the pace of deterioration of credit markets as well as the capital gains tax changes as implying that the UK housing market's rate of decent would start to accelerate from April 2008 and could be termed as a housing market crash -
November 2007 - Crash in UK House Prices Forecast for April 2008 As Buy to Let Investors Sell. - The timing for the sharp drop is likely to coincide with Labour's change on capital gains tax which effectively cuts the tax payable on gains accumulated over the last few years to 18% from 40%. This tax change comes into force on 1st of April 2008 and thus the expectation is for an avalanche of selling amongst buy to let investors to lock in profits.
This also means that the market will to some degree be artificially supported going into April 08, but still will not be enough to prevent a wider decline in UK house prices but rather could register a drop of as much as 5% in the quarter April 08 to June 08 , which would represent a crash in UK house prices.
July 2008 - UK House Price Crash In Progress! - The summer months subsequently witnessed the crash in UK house prices come to pass as house prices look set to full fill the original forecast for a 15% fall well ahead of the original time line with the risks that despite soaring inflation data, the housing bear market threatened imminent deflation, which has now increasingly become the mainstream story which was originally highlighted in the analysis of March 2008.
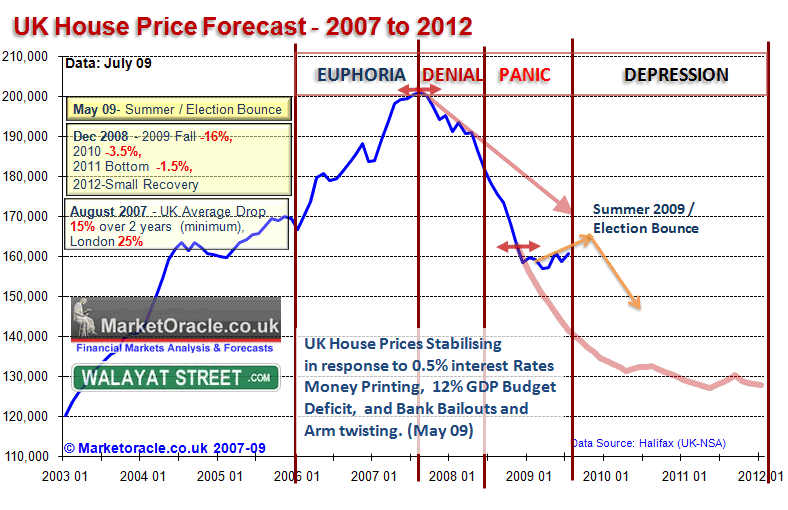
January 2009 - UK Housing Market Depression Forecast - In depth analysis of 4th January 2009, forecast a continuing crash that would morph into a prolonged depression for several years that despite containing bounces, that house prices were unlikely to see a final bottom until late 2011 / early 2012 as the below graph illustrates.
March 2009 - House Price Bounce Warning Signs- The mainstream press as epitomised by the Telegraph ran with a ridiculous story that Uk house prices could fall by another 55%, which prompted analysis that concluded that the forecast for a possible another 55% fall in UK house prices EXTREMELY unlikely. If anything the extreme measures of zero interest rates and quantitative easing implied a far shallower trend that suggested a stagnating market rather than anything like another 55% drop.

Summer Bounce 2009 - The unfolding bounce or blip in UK house prices prices is inline with my May analysis that concluded that UK house prices will experience a bounce during the summer months from extremely oversold levels as a consequence of liquid buyers returning to the market and the debt fuelled economic recovery which 'should' be reflected in rising house prices during the summer months that is increasingly being taken by the mainstream press and vested interests to announce that the house prices have bottomed.
My next analysis will compare UK house prices to the GDP growth rate. To ensure that you receive the full final analysis and conclusion / forecast for the UK housing market covering the trend for the next 2-3 years subscribe to my always free newsletter.
By Nadeem Walayathttp://www.marketoracle.co.uk
Copyright © 2005-09 Marketoracle.co.uk (Market Oracle Ltd). All rights reserved.
Nadeem Walayat has over 20 years experience of trading derivatives, portfolio management and analysing the financial markets, including one of few who both anticipated and Beat the 1987 Crash. Nadeem's forward looking analysis specialises on the housing market and interest rates. Nadeem is the Editor of The Market Oracle, a FREE Daily Financial Markets Analysis & Forecasting online publication. We present in-depth analysis from over 300 experienced analysts on a range of views of the probable direction of the financial markets. Thus enabling our readers to arrive at an informed opinion on future market direction. http://www.marketoracle.co.uk
Disclaimer: The above is a matter of opinion provided for general information purposes only and is not intended as investment advice. Information and analysis above are derived from sources and utilising methods believed to be reliable, but we cannot accept responsibility for any trading losses you may incur as a result of this analysis. Individuals should consult with their personal financial advisors before engaging in any trading activities.
Nadeem Walayat Archive |
© 2005-2022 http://www.MarketOracle.co.uk - The Market Oracle is a FREE Daily Financial Markets Analysis & Forecasting online publication.


