Silver and its Long-term Cycles
Commodities / Gold & Silver Jun 16, 2007 - 08:03 PM GMTBy: Tim_Wood
 There are two long-term cycles in silver that have historically proven significantly meaningful. The first is the 5-year cycle and the second is the 10-year cycle, with the 10 year cycle being the more dominate of the two cycles. It is important to understand that cycle analysis is nothing more than a method of quantifying market trends of similar degree. Because market cycles ebb and flow and are not rigid, we have to look at the common denominators and develop averages. We can then use these common denominators and averages as a guide for what might be expected in the future.
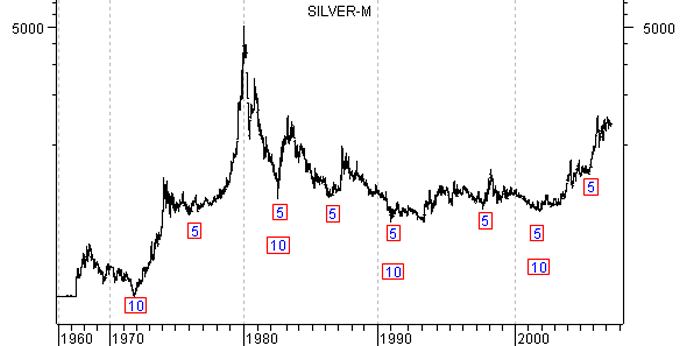
Over time the so-called 5-year cycle in silver has averaged 61.33 months from low to low, with the 10-year cycle averaging 120.6 months. Again, these are averages and some cycles have run longer than these averages and some have run less. It is the average that we are interested in.
Looking at the first chart below I have marked the 5 and 10-years cycle bottoms of the last 40 years. The last 10-year cycle bottomed in November 2001 and the last 5-year cycle bottomed in August 2005. Based on this phasing and if these cyclical patterns continue to hold true in the future, the next 5 and 10-year cycles should bottom together and that low is ideally due between 2010 and 2011.

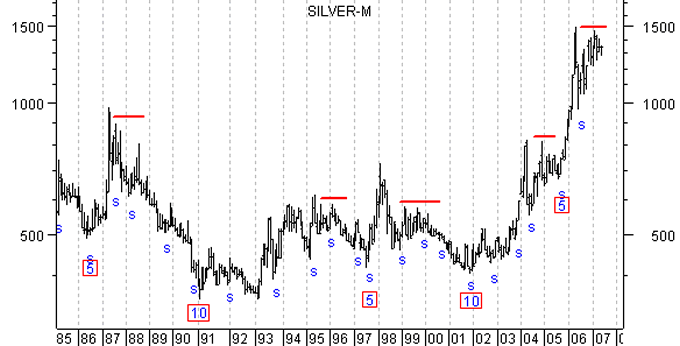
In addition to these averages, we are also interested in any common denominators surrounding the 5 and 10-year cycle tops and bottoms. The monthly chart below is a nearer term view covering the last 20 years of price action in silver. Here, we again have the 5 and 10-year cycle lows marked, but I have also marked the shorter-term annual cycles, which are marked by the blue S's. This cycle averages some 12 months in duration from low to low and it is its relationship with the 5 and 10-year cycles that has historically provided a common denominator at both 5 and 10-year cycle tops and bottoms.

Given that the most recent 5 and 10-year cycle lows are behind us, it is the identification of the 5 and 10-year cycle top that is now the most important. In looking back at the common denominators surrounding previous tops I found that every 5 and 10-year cycle top has historically been marked by a failed annual cycle advance. When I say failed, I'm simply referring to an annual cycle that failed to move above the previous annual cycle top. The first example of this can be seen in 1987 at the August failed annual cycle top, which was followed by a further decline into both the 5 and the 10-year cycle lows that bottomed in 1991.
A second example of this can be seen at the 1996 failed annual cycle top that was also followed by a decline into the 1997 5-year cycle low. In 1999 there was another failed annual cycle advance and this time it occurred in association with the cycle tops marking the decline into the 5 and 10-year cycle lows that occurred in 2001. Next, we have the 2004 failed annual cycle top and this time it was associated with a modest decline into the 2005 5-year cycle low.
This now brings us to the current setup in silver. The last annual cycle low occurred in June 2006 and topped in February 2007. The decline into the current annual cycle low is still underway. As a result, the issue here is that this most recent annual cycle advance failed to carry price back above the 2006 annual cycle high. Thus, the risk to silver is that we once again have what appears to be a failed annual cycle advance. With us now in the second 5-year cycle within the longer-term 10-year cycle, the longer-term risk factor here is that the 10-year cycle top may have also occurred. If the historical common denominators or relationships between these cycles continue to hold, then yes the 10-year cycle top appears to now be in place.
The key is whether or not the May 2006 high can be exceeded once the coming annual cycle low is made and at present that is only about two dollars away. So, bettering the May 2006 high should not be that big of a stretch if the 10-year cycle advance is actually still intact. The next opportunity for silver to overcome this potentially negative setup will come once the annual cycle low is made and confirmed by an upturn of the Cycle Turn Indicator. If this level can be exceeded as price turns up out of the coming annual cycle low, then the current 5 and 10-year cycles live on. But, until such time we do in fact have a failed annual cycle in the making and for what it's wroth, we know what this has meant in the past. I will add that there are also other common denominators that I have found and in which I am continuously monitoring. I am also totally aware that some will argue that this time is different for one reason or another and truth is, this is indeed a different time. No argument about that here at all. But, nonetheless, the advance out of the next annual cycle low must exceed the May 2006 high if any of these differences are going to matter. It's just that simple.
I have begun doing free Friday market commentary that is available to everyone at www.cyclesman.com/Articles.htm so please begin joining me there. Should you be interested in analysis that provides intermediate-term turn points utilizing the Cycle Turn Indicator on stock market, the dollar, bonds, gold, silver, oil, gasoline, the XAU and more, then please visit www.cyclesman.com for more details. A subscription includes access to the monthly issues of Cycles News & Views covering the Dow theory, and very detailed statistical based analysis plus updates 3 times a week.
By Tim Wood
Cyclesman.com
© 2007 Cycles News & Views; All Rights Reserved
Tim Wood specialises in Dow Theory and Cycles Analysis - Should you be interested in analysis that provides intermediate-term turn points utilizing the Cycle Turn Indicator as well as coverage on the Dow theory, other price quantification methods and all the statistical data surrounding the 4-year cycle, then please visit www.cyclesman.com for more details. A subscription includes access to the monthly issues of Cycles News & Views covering the stock market, the dollar, bonds and gold. I also cover other areas of interest at important turn points such as gasoline, oil, silver, the XAU and recently I have even covered corn. I also provide updates 3 times a week plus additional weekend updates on the Cycle Turn Indicator on most all areas of concern. I also give specific expectations for turn points of the short, intermediate and longer-term cycles based on historical quantification.
Tim Wood Archive |
© 2005-2022 http://www.MarketOracle.co.uk - The Market Oracle is a FREE Daily Financial Markets Analysis & Forecasting online publication.


