


The Three Bears Who Forecast the Goldilocks Stock Market
Stock-Markets / Financial Markets 2009 Aug 17, 2009 - 08:55 AM GMT

 Charles Nenner, former Goldman Sachs market timing analyst, uses cycles, technical analysis, and a macro approach to time myriad markets. He called for a 2007 market top at around Dow 14,300. In 2008, he warned of a 30%+ decline in equities and in February of this year, he called for a large rally to take us to S&P 1000.
Robert Prechter, founder of Elliott Wave International, uses Elliott Wave Principles, cycle theory, and investor sentiment to gauge market turning points. In summer 2007, less than three months before the all-time stock market top, Prechter issued a short recommendation and didn’t cover until February 23 of this year, days before the March lows, as he predicted a large bear bounce to S&P 950ish.
Bob Janjuah, RBS chief credit strategist, issued a “stock crash alert” in June of last year, predicting a market crash and credit event in September 2008. He then predicted a large “relief rally” early this summer. So what do all these people have in common? Besides their past predictions?
Their current predictions.
Margin Call in Shanghai.
Bank of China to speculators: “You’ve had enough.”
The VIX may be ready for its breakout.
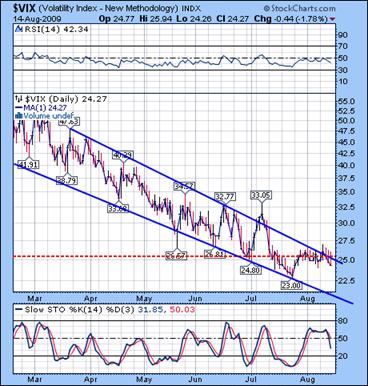
--After Friday’s Consumer Price Index was reported, the markets sold off, only to do a partial recovery on Friday afternoon. From an Elliott Wave perspective, the decline in the VIX was a wave c of an a-b-c correction. Even though it is below Critical Support at 25.60, the reversal pattern now appears complete. A rally above Critical Support should break out of the wedge.
The SPX may have a serious decline ahead…
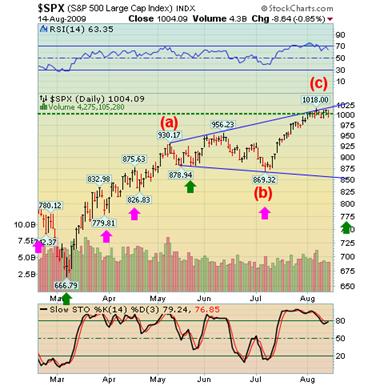 --The SPX kept its 1018 top from August 7th. To that extent, it parallels the recovery rally from the Crash of 1929. It also has taken exactly the same number of days from bottom to top – 154.
The indexes are in the window now for a Trading Cycle bottom. In addition, the Primary Cycle bottom is also due in the next week. The irony of the protracted top is that the bottom may happen during options expiration week. Critical Support is at 1004. On should not be long below this level, since the new target is 800-850.
The NDX consolidation may be over.
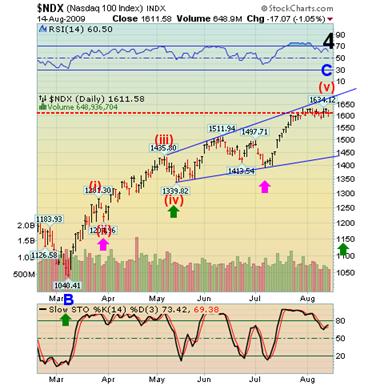
--The NDX reached a new high on Thursday. Friday’s activity shows a clear reversal pattern and appears ready to resume its decline. Critical Support at 1612 is the level below which things become more bearish in the NDX. The next target is below 1395, which is the July low.
GLD showed even more weakness last week.
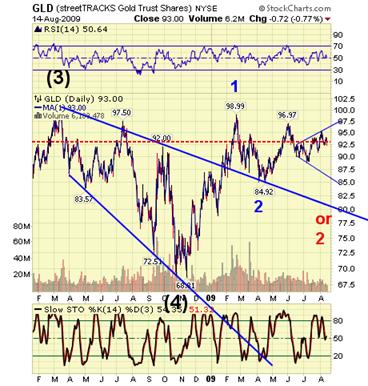
-- GLD has remained below Critical Support Friday at 93.23 and appears to be ready to decline even more next week. One very probable target may be the bottom of the expanding triangle, which is approaching 85. So I have maintained a sell signal over the last week. It appears that GLD is being influenced by the same powers governing the equities market. Margin calls, anyone.
The Oil Bubble is letting out air.
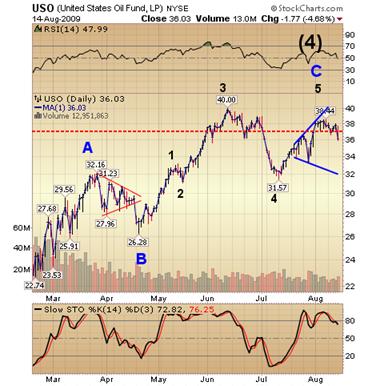
--USO has also stayed below Critical Support/Resistance last week. The dominant pattern also appears to be a triangle formation that is expanding in the same manner as GLD. The pattern now calls for a decline at least to the bottom of the expanding triangle if not much deeper. It has stayed below critical resistance at 37.21 and is on a sell signal.
TLT is advancing again.
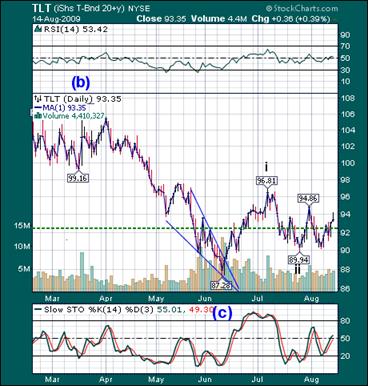
-- Treasuries rose, pushing yields to the lowest level in almost a month, as Asian and European stocks fell and a gauge of demand for corporate bonds slid, increasing investor appetite for the relative safety of government debt. Critical Support is at 92.40. The rally should be sustained and a breakout above 96.81 is in the works.
UUP breaking out of tis bullish wedge.
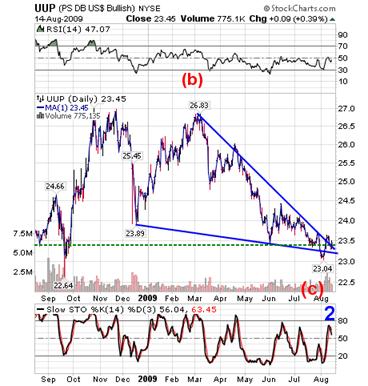
--UUP has spent the last several days retesting the bullish wedge formation and its own Critical Support at 23.50.
A breakout above 23.70 should be a clear indication that the trend is now changed. Bullish wedges tend to be fully retraced, so I expect a strong rally to develop in UUP.
Regards,
Tony
Our Investment Advisor Registration is on the Web
We are in the process of updating our website at www.thepracticalinvestor.com to have more information on our services. Log on and click on Advisor Registration to get more details.
If you are a client or wish to become one, please make an appointment to discuss our investment strategies by calling Connie or Tony at (517) 699-1554, ext 10 or 11. Or e-mail us at tpi@thepracticalinvestor.com .
Anthony M. Cherniawski,
President and CIO
http://www.thepracticalinvestor.com
As a State Registered Investment Advisor, The Practical Investor (TPI) manages private client investment portfolios using a proprietary investment strategy created by Chief Investment Officer Tony Cherniawski. Throughout 2000-01, when many investors felt the pain of double digit market losses, TPI successfully navigated the choppy investment waters, creating a profit for our private investment clients. With a focus on preserving assets and capitalizing on opportunities, TPI clients benefited greatly from the TPI strategies, allowing them to stay on track with their life goals
Disclaimer: The content in this article is written for educational and informational purposes only. There is no offer or recommendation to buy or sell any security and no information contained here should be interpreted or construed as investment advice. Do you own due diligence as the information in this article is the opinion of Anthony M. Cherniawski and subject to change without notice.
Anthony M. Cherniawski Archive |
© 2005-2022 http://www.MarketOracle.co.uk - The Market Oracle is a FREE Daily Financial Markets Analysis & Forecasting online publication.
Comments
|
Nadeem_Walayat
17 Aug 09, 16:03 |
Stock Market Forecasts
Not a competition, but - I called the market bottom at 6,600 in January 2009 over a month before Prechter, as well as at the same time signaling a 30% rally, some months before the other forecasters.Dow Jones Stock Market Forecast 2009 Also the above is not accurate on Prechter, he remained bearish despite covering shorts i.e. Vague on the rally - Robert Pretcher's Greatest Trade Ever! Stocks Bear Market Could See Spike Higher On Bloomberg TV, Robert Prechter advises his clients to close their short positions and prepare for a possible strong spike higher as stock prices hit 11 year lows as investor sentiment indicators reached extreme bearish levels. However he also sees at least another 2 years for the stocks bear market before it bottoms due to the wave count and earnings fundamentals. Extreme investor sentiment indicators also point to a significant top in Gold and Treasury Bonds. Confirmed Stock market Bottom mid March 2009 - Stealth Bull Market Follows Stocks Bear Market Bottom at Dow 6,470 Most recent analysis on where next - Vicious Stocks Stealth Bull Market Eats the Bears Alive!, What's Next? |