Gold Bull Market Buy the Dips and Crude Oil About to Breakout
Commodities / Gold & Silver Jun 14, 2007 - 06:14 PM GMTBy: Peter_Degraaf
“Ye got yer good news, and ye got yer bad news”
The bad news is that some of you were influenced by the ‘gold bears' who are forever looking at the ‘half-full' glass and calling it ‘half-empty'. You either sold during the past few days, or you allowed these bears to rob you of some good sound sleep!
Will these gold bears ever learn this simple trading rule: WHEN THE 200 DAY MOVING AVERAGE IS RISING, EVERY DIP TOWARDS, OR EVEN BELOW IT, IS AN OPPORTUNITY TO BUY!
Or how about this: “He/she who buys the dips and rides the waves usually comes out a WINNER!”
The good news is that the fundamentals for gold are as sound as ever! The World Gold Council report dated June 7/2007 AD shows world gold demand is running 31% above last year!
China and India are increasing their gold purchases, with India having bought 211 tonnes during Q1/07, double what they bought during Q1/06! Meanwhile mine production is declining. If it were not for central bank sales, gold would be selling at double today's price! And these bankers can only sell it once. Then its gone.
There was more BAD NEWS this morning, and gold initially dropped 3.00; the news release that Switzerland is going to sell 250 tonnes of gold during the next 2 years. What a pity that even the Swiss money managers feel compelled to sell their treasure, supposedly to pay off debt. The fact that gold only dropped 3.00 is GOOD NEWS! The increasing demand from India alone, projecting their quarterly increase out over the next two years, will more than absorb this ‘gold give-away'.
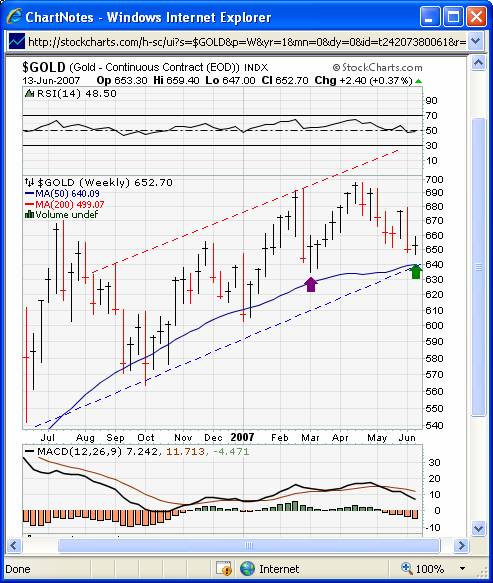
Featured is the weekly gold chart. The channel is well defined, and the green arrow points to an upside reversal, or climax. When an upside reversal occurs near a support line, price usually carries on for a month or more. The previous reversal (purple arrow) preceded 6 weeks of rising prices.
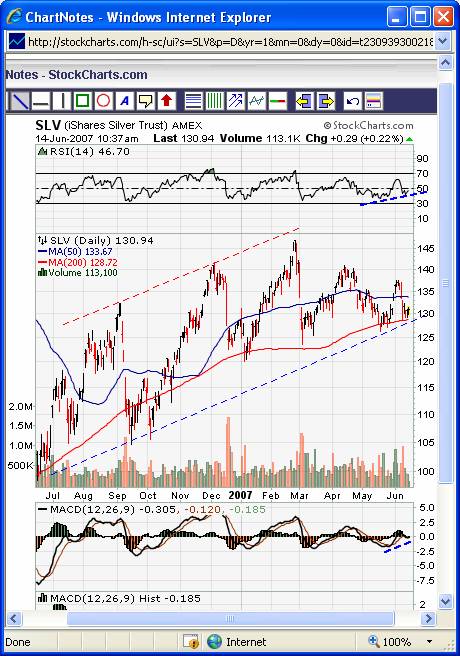
Featured is the SLV electronic silver unit. The channel is well defined, the 50DMA is in positive alignment to the 200DMA, (both of which are rising), and the progression of higher lows is ongoing. The RSI and MACD (short blue dashed lines), support the upward bounce.
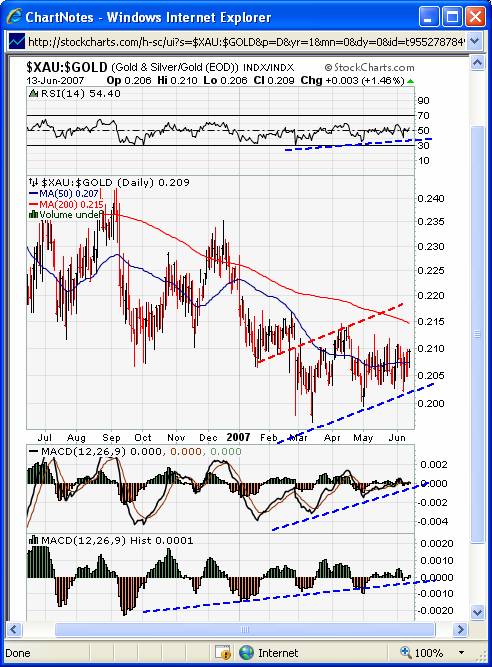
Featured is the chart that compares the XAU mining stocks index to the gold price.
Experienced traders know that one of the gauges to determine if gold is going to rise or fall is to see which is stronger: gold or the gold mining stocks. During a correction, mining stocks fall faster, and during the ‘up phase' stocks rise faster, caused by leverage to the gold price. Since mid-March this index has been turning up, in a move that is supported by the RSI and MACD indicators (blue dashed lines).
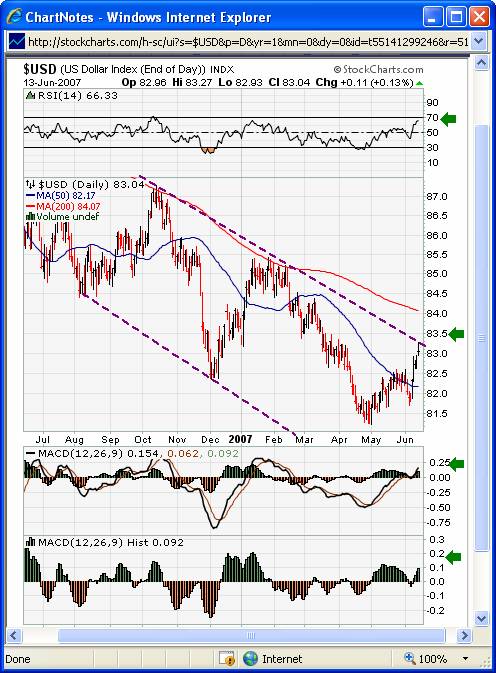
Featured is the US dollar daily bar chart. The green arrows are targets that have either been reached, or are close to being reached. The negative effect that the dollar has had on the metals for the past 5 weeks is most likely behind us for a while.
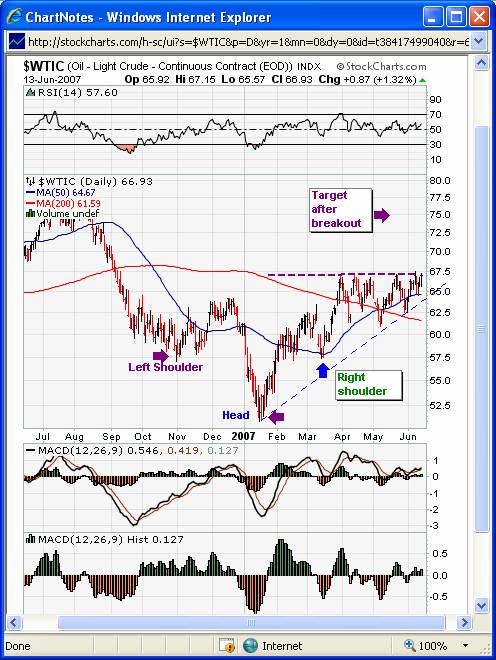
Featured is one of the most exciting charts in my arsenal. It is a combination of an inverted ‘heads and shoulders' formation, along with an ARAT, (Advancing Right Angled Triangle). The ongoing attempt to break out at the horizontal resistance line, is the fifth attempt, and it is the nature of an ARAT to offer less resistance at each attempt, as the energy to withstand the upward thrust is diminished with every attempt. All we need is two closes above 67.00, and we will be looking at a 75.00 target. This has serious ‘price inflationary' implications, and will be bullish for the Precious Metals, and it could happen any day now!
By Peter Degraaf.
Peter Degraaf is an online stock trader with over 50 years of metals trading experience. He sends out a weekly E-mail to his many subscribers. For a 60 day free trial, contact him at ITISWELL@COGECO.CA
DISCLAIMER: Please do your own due diligence. I am NOT responsible for your trading decisions.
Peter Degraaf Archive |
© 2005-2022 http://www.MarketOracle.co.uk - The Market Oracle is a FREE Daily Financial Markets Analysis & Forecasting online publication.


