


Stock Markets Remain Strong
Stock-Markets / Stock Index Trading Jul 30, 2009 - 06:08 AM GMTBy: Frederic_Simons

 Stock markets have experienced a very short consolidation phase over the last two days, without giving back much ground. Overnight, the Nasdaq future has even moved to new highs. What we have written in our last comments to the stock market remains true, as we are still expecting stocks to move higher in the next days and perhaps weeks to come:
"In fact, for those not in a long position and waiting for pullback to jump aboard, any further increase in prices adds to the existing psychological pressure to join the party. This could be a reason why every little pullback during the day is bought, pushing prices to new highs every day. Secondly, there may well be several consecutive weeks of rising equity prices. Rising prices tend to result in a positive feedback that leads to prices climbing even higher."
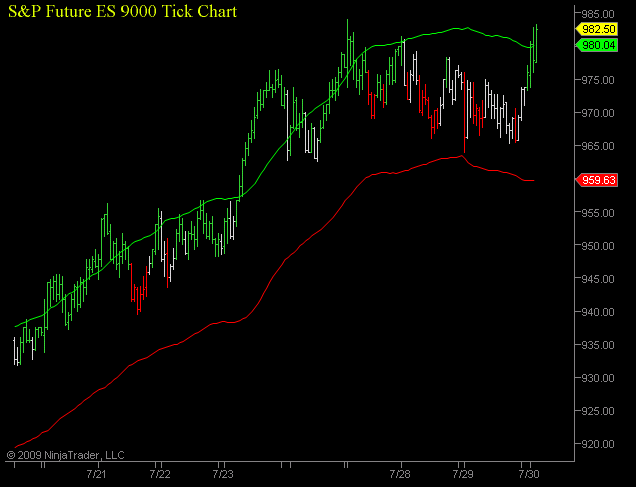
The following charts show a shorter and a intermediate term chart for the S&P E-mini Future:
[Please click here for additional information about the trading system and how to read the charts]
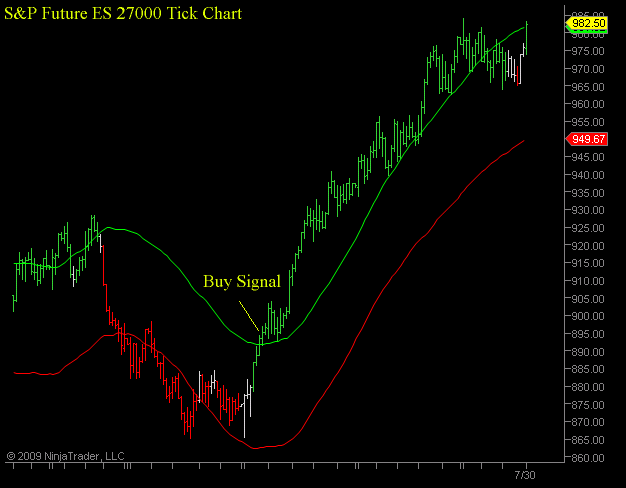
The 27000 Tick chart and the shorter term 9000 Tick chart are still bullish. The bigger picture 27000 Tick chart shows that the S&P Future would have to trade below 949.5 for two consecutive bars to turn the intermediate chart bearish. Even in the shorter term chart, only a pullback below 959 should make bulls a little hesitant.
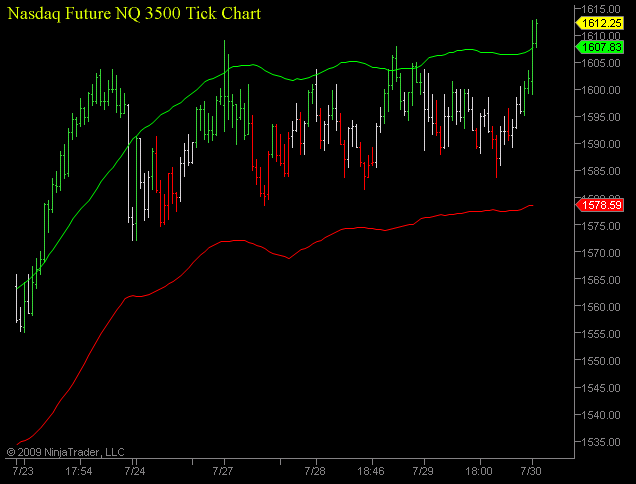
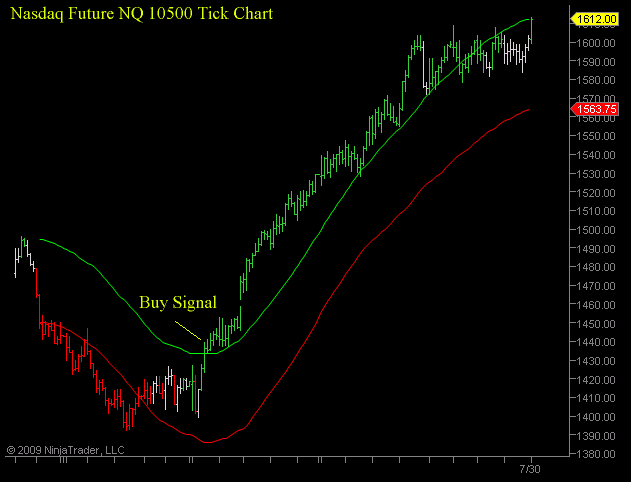
The Nasdaq also shows bullish charts that currently offer little reason to become a stock market bear:
As a conclusion, the S&P 500 and the Nasdaq are still in their strong uptrend, with bulls firmly in control. The line of least resistance is pointing to more upside in prices. As long as the S&P trades above 949.5, only the sky is the limit. In fact, trends often tend to accelerate before they end, and bears should prepare for some serious short squeeze that might take prices well above 1000 in the S&P.
If you have any questions, please do not hesitate to contact us by writing an email to

New: Discounted subscription fees for retail (non-professional) investors. 3 Month subscription for only 75 USD !
By Frederic Simons
http://www.crossroadsfx.hostoi.com
© 2009 Copyright Frederic Simons - All Rights Reserved
Disclaimer: The above is a matter of opinion provided for general information purposes only and is not intended as investment advice. Information and analysis above are derived from sources and utilising methods believed to be reliable, but we cannot accept responsibility for any losses you may incur as a result of this analysis. Individuals should consult with their personal financial advisors.
© 2005-2022 http://www.MarketOracle.co.uk - The Market Oracle is a FREE Daily Financial Markets Analysis & Forecasting online publication.