


Gold Marking Time Ahead of Next Direction Explosion, Up or Down?
Commodities / Gold & Silver 2009 Jul 25, 2009 - 03:04 PM GMTBy: Merv_Burak

 It was actually somewhat of a BLAH week in the market. Monday was gang busters and then nothing for the rest of the week. Gold seems to be marking time waiting for the next explosion, up or down.
PRECIOUS METAL FUNDAMENTALS
It seems that a lot of readers continually want to know what’s happening in the precious metals industry, where it is now, where it is going, etc. Curiosities that delve into the fundamental side of the market. You will not get any of that information here. That takes a lot of study and knowledgeable experience, none of which I claim to have. In addition, it takes a lot of time to keep up with the fundamentals, time which is scarce. I could post what others are saying but you are far better off by going to the multitude of web sites that specialize in the fundamentals and get your information directly.
Here, you will get the technical side of the daily/weekly market activity in the metals and stocks. The technical side does not worry about the WHY behind the moves in the securities, it just tries to decipher the direction of the market move, the strength or weakness of the move and go with the flow. When the flow changes, for whatever reason, we change with it. The fundamentals will usually come later.
So please, do not expect to find fundamental information in these commentaries.
GOLD
LONG TERM
The long term P&F chart is still in a bullish phase but it has now set a new upper support at the $915 level. A move to $900 would break below the support and two previous lows as well as an up trend line for a trend reversal signal. Just something to keep in the back of one’s mind if the price should start to drop.
As for our normal chart and indicator analysis, things are still a-okay for now. The price of gold remains above its positive sloping moving average line and the long term momentum indicator (daily version) remains in its positive zone above its positive trigger line. The volume indicator is at its highest point since its highs in late February and is above its long term positive trigger line. Nothing here yet to get worried from the long term standpoint. The rating remains BULLISH.
INTERMEDIATE TERM
Since the end of January the price of gold has been basically in a wide lateral drift with the upper and lower barriers at about the $1000 and $870 levels. I guess as long as it remains in this box, with the right wall continually moving further to the right, it would be hard to really guess which way the eventual direction of future trend will be.
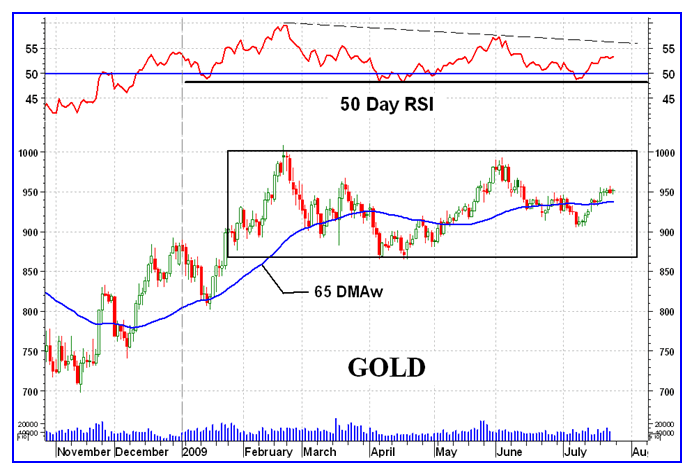
While in this box the intermediate term moving average line will move in a basically lateral direction and the price of gold will continue to fluctuate above and below the moving average line. This makes it very difficult to definitively gauge the influence a crossing of the moving average line by the price will have. So, although I will continue with my normal commentary as to the positive or negative nature of the price versus its intermediate term moving average line one should keep in mind this box situation. An intermediate term trend will most likely start inside the box but its confirmation must await a move outside the box.
Having given myself the cop-out excuse in case my analysis is wrong, let’s go to the intermediate term analysis.
The price of gold has once more moved above its moving average line and the line slope is once more in the positive direction. The momentum indicator has set up a strong support just above the 48% level. This would be a level to watch (instead of the 50% level) for a real change in strength of the price move. In the mean time the momentum continues in its positive zone above its positive trending trigger line. The volume indicator is also trending positively and remains above its positive sloping trigger line. All normal indicators give me an intermediate term rating as BULLISH, at this time.
SHORT TERM
From the short term perspective we are still in good shape. The price remains above its positive trending moving average line and the momentum indicator remains in its positive zone just above its positive trigger line. As for the daily volume action, well that could be a little better but I wouldn’t complain yet. All in all, the short term rating is BULLISH.
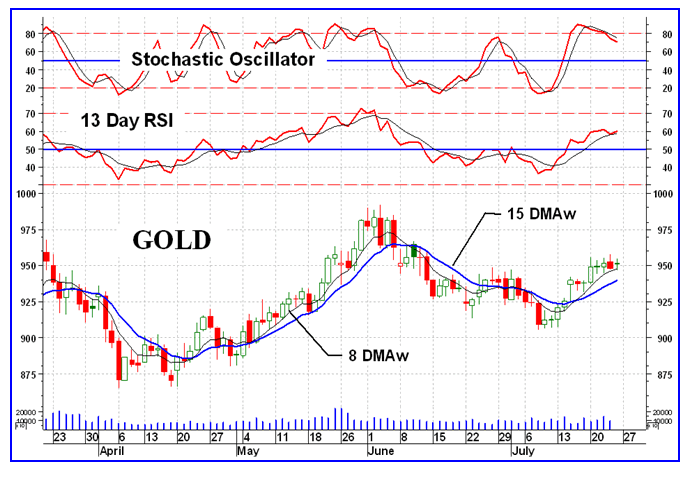
As for the immediate direction of least resistance, that’s another story. We have the price above its very short term positive moving average line (8 DMAw) while the line remains above the short term line. However, if one looks carefully the moving average line has started its turn towards the negative (although it’s not there yet) in keeping with the lateral move of the price over the past few days. Of greater concern is the action of the more aggressive Stochastic Oscillator. It had topped out in its overbought zone and has now dropped below the overbought line and its trigger line. It is now heading lower. This is too often a precursor to a turn down in the price, at least for a short while. So, I must go with the down side as the direction of least resistance until something in the indicators changes.
SILVER
First, a quick comment on my P&F chart of silver. It has set up a strong support at the $12.00 level. A move to $11.50 would break that support and would break below an up trend line. From a P&F standpoint this is the level to watch. Until then silver remains long term bullish, P&F wise.
Silver still has a better performance versus gold over the intermediate and long term but is losing its advantage. Although this past week it performed better than gold it still has some catching up to do from the shorter term standpoint. A comparison of the two short term charts here shows that silver dropped more than gold in June and although it is recovering nicely these past two weeks it is a catch-up game and still better performance is required.
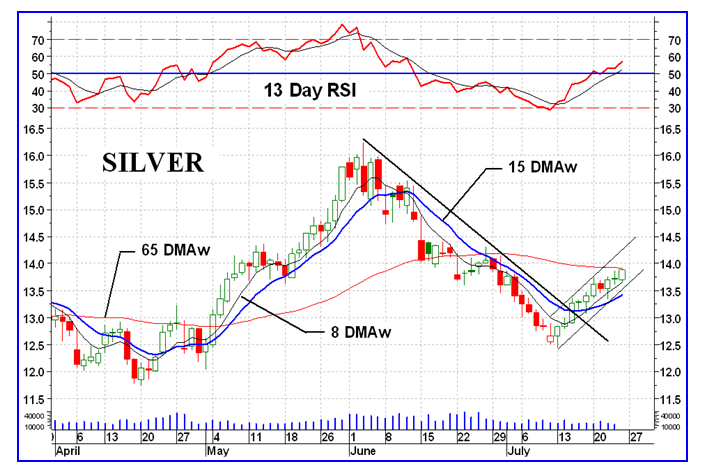
From a long term perspective silver had dropped below its moving average for a couple of weeks in early July but is back above the moving average. The average continues to slope upwards. The momentum indicator also dropped into its negative zone at the same time but is also back into the positive, above its positive trigger line. For the long term the rating is back into a BULLISH rating.
The intermediate term is not quite so lucky. Although the momentum indicator has moved back into its positive zone and above its positive trigger line the price of silver remains just below its intermediate term moving average line. The line itself is still in a negative slope. The volume indicator has been moving in a basic lateral direction over the past couple of months although it is presently above its positive sloping trigger line. On the intermediate term the best I can give the rating is a – NEUTRAL rating. Next week, should the price of silver advance again most likely this rating will go full bullish. But we’ll have to wait for it.
The short term is more encouraging. It often tells us what’s ahead for the other time periods. The price is above its moving average line and the line is sloping upwards. The very short term moving average line remains above the short term line for a direction confirmation. The momentum indicator is in its positive zone above its positive trigger line and heading higher. Only the daily volume activity could be a whole lot better. The recent two week advance in price was not accompanied by any significant increase in volume activity, in fact the daily volume seemed to have dried up. This is a real concern for the longevity of this rally. In the mean time the short term rating is BULLISH.
As with gold, the silver Stochastic Oscillator had entered its overbought zone a little over a week ago but unlike gold the Stochastic remains inside its overbought zone. The internal weakness that would have pushed the SO below its overbought line had not yet entered the daily silver action. For this reason I think that silver may be heading for a lateral drift period although a negative reversal potential, as with gold, is not out of the picture.
PRECIOUS METAL STOCKS
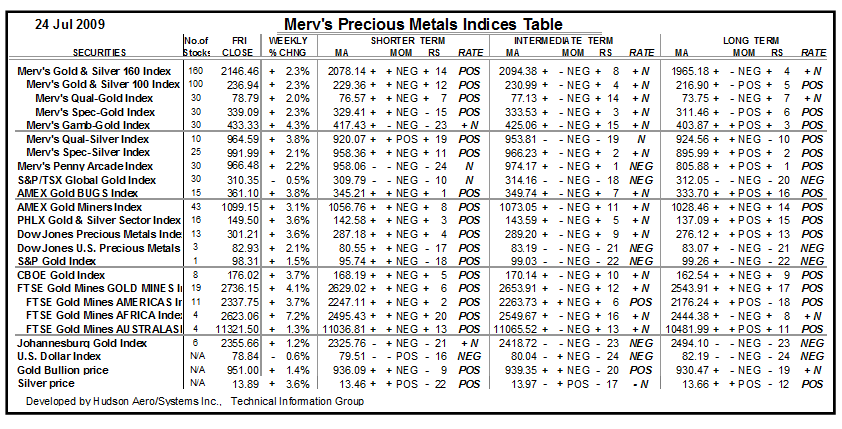
Looking over the various stock Indices in the Table below we see that it was a generally okay week for the stocks with an average stock advancing just above 2%. The North American Indices did slightly better than that but that was due to the weighting given the few large stocks in their Indices. Looking through the individual stocks there were just slightly better than 50% moving higher while the rest moved lower or not at all. Not such a ringing endorsement as the Indices would suggest.
Although we have had two weeks of rebound or rally activity in the stocks the latest move is just not all that encouraging. Stocks are moving in the right direction but it just doesn’t have that “feeling” of a good move in progress. Yes, I know, a technician should not let “feelings” get in the way of solid technical analysis BUT something just doesn’t feel right. I can’t place my finger on it and I don’t really see anything outwardly negative in the indicators. Maybe it will go away next week. Let’s hope so. This reminds me of the analyst from somewhere in the U.S. North West who used to provide stock recommendations (this was in the ‘60s) depending upon if his bunions were aching or not. The SEC tried to shut him down and again, if memory is accurate, he took this all the way to the U.S. Supreme Court and won. It seems that they have this strange concept in the U.S. called “freedom of speech”. Boy, I wish we had one of those here in Canada. Of course with the new U.S. Administration that concept may be destined for the scrap heaps in the U.S. also.
MERV’S PRECIOUS METALS INDICES TABLE
Well, that will be it for this week.
By Merv Burak, CMT
Hudson Aero/Systems Inc.
Technical Information Group
for Merv's Precious Metals Central
For DAILY Uranium stock commentary and WEEKLY Uranium market update check out my new Technically Uranium with Merv blog at http://techuranium.blogspot.com .
During the day Merv practices his engineering profession as a Consulting Aerospace Engineer. Once the sun goes down and night descends upon the earth Merv dons his other hat as a Chartered Market Technician ( CMT ) and tries to decipher what's going on in the securities markets. As an underground surveyor in the gold mines of Canada 's Northwest Territories in his youth, Merv has a soft spot for the gold industry and has developed several Gold Indices reflecting different aspects of the industry. As a basically lazy individual Merv's driving focus is to KEEP IT SIMPLE .
To find out more about Merv's various Gold Indices and component stocks, please visit http://preciousmetalscentral.com . There you will find samples of the Indices and their component stocks plus other publications of interest to gold investors.
Before you invest, Always check your market timing with a Qualified Professional Market Technician
Merv Burak Archive |
© 2005-2022 http://www.MarketOracle.co.uk - The Market Oracle is a FREE Daily Financial Markets Analysis & Forecasting online publication.