


Gold and Gold Stocks Preparing to Rocket Higher
Commodities / Gold & Silver 2009 Jul 23, 2009 - 04:29 AM GMTBy: Chris_Vermeulen

 It’s that time again when the gold bugs come crawling out of the wood work.
Monthly, weekly and daily charts are all about to move close together and when then happens be ready to buy gold and gold stocks (golden rockets). Technically speaking we are still a long way from the HUI monthly chart breaking out to the up side. But if this bullish price action continues our weekly and daily trading signals will reap big rewards as we enter gold early before the next leg (rally) higher.
Breakout Sequence and Trader Type:
- Daily Chart – short term traders
- Weekly Chart – intermediate term swing traders
- Monthly Chart – long term investors
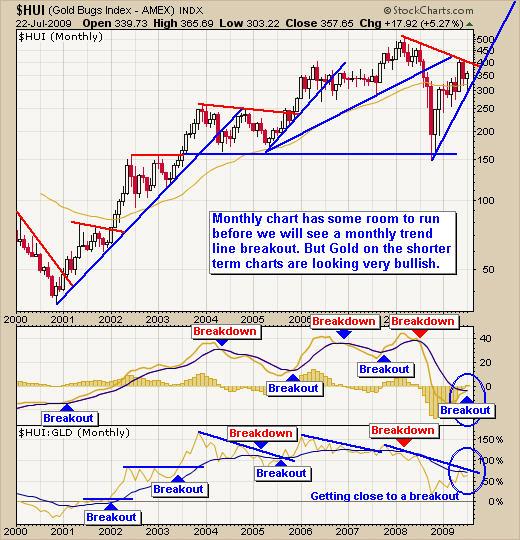
HUI – Gold Stocks Index Monthly Chart
As you can see from the chart the momentum (MACD) has crossed over which is bullish. The HUI:GLD ratio indicator is moving higher and about to breakout as well. These are very bullish signs for gold in the months to come. I use the daily chart to enter and exit but the longer term charts provide me with the overall trend and momentum (power behind the move).
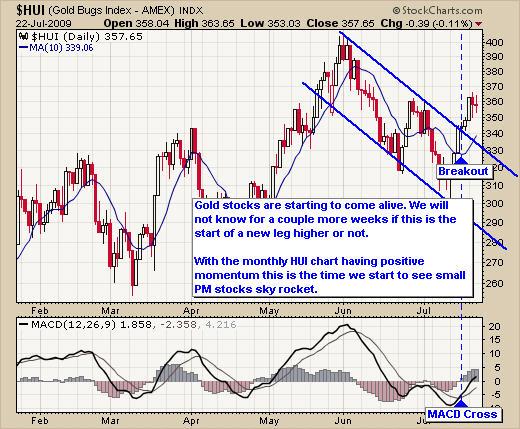
HUI – Gold Stock Index Daily Chart
The daily chart has a lot more price action which is great for short term traders. As you can see gold stocks broke out last week from the downward trend channel. This is a bullish sign and the first step towards a much larger rally.
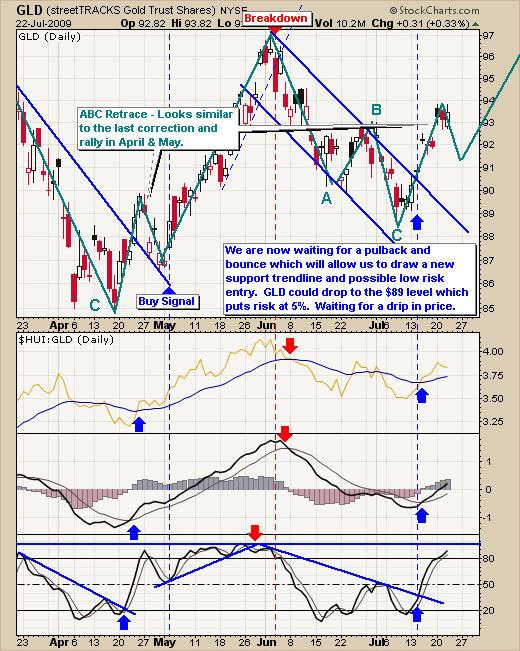
GLD – Gold Exchange Traded Fund - Daily Chart
Gold is forming a similar pattern to the pre-May rally as noted on the chart. I am looking for a pullback in price which will allow for a low risk setup. I do not like to chase prices higher because risk increases substantially and there is generally a pullback providing an entry point in the following days.
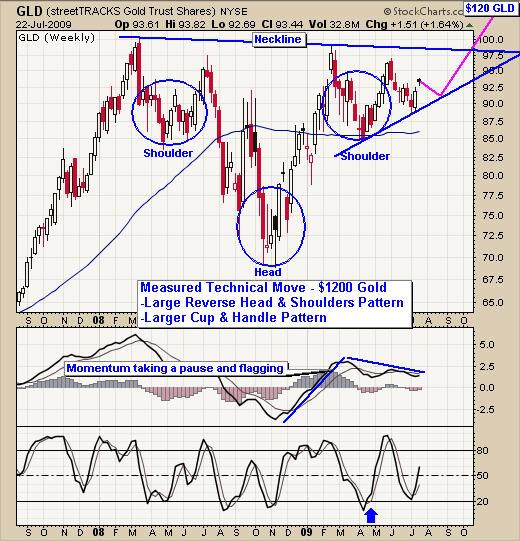
GLD – Gold Exchange Trade Fund Weekly Chart
The weekly chart has yet to breakout and the momentum has not turned positive yet. This is one really nice looking chart. It has multiple bullish patterns all converging at the same point which could create an EXPLOSIVE rally higher in the month to come.
On the weekly chart we see these bullish chart patterns:
- Large Reverse Head & Shoulders – Very Bullish
- Large Cup & Handle Pattern – Extremely Bullish
- Bull Flag/Pennant – Bullish
We continue to wait for gold to work out the kinks and provide us with a low risk entry point. From a seasonal stand point Sept, Oct, and Nov are strong months for gold and I expect the move to happen then if it rallies.
Gold Sector Trading Conclusion:
It feels as though we are on the verge of a big gold rally. This is if the US financial lords run out of money to short bullion or finally run out of gold to sell. Either way; once gold starts to running I don’t thing there will be much looking back until the $1200-$1500 level.
Gold stocks are now starting to show signs of life and when that happens in conjunction with the monthly, weekly and daily charts are forming bullish breakouts, look for some Golden Rockets which are junior stocks which have good cash flow and a solid management team behind it.
We continue to wait with our finger on the buy button for gold as prices drift sideways on the weekly chart. With everyone so bullish on gold I have to wonder if we are about to get a sharp correction hence the reason I wait for a low risk setup.
Hello, I'm Chris Vermeulen founder of TheGoldAndOilGuy and NOW is YOUR Opportunity to start trading GOLD, SILVER & OIL for BIG PROFITS. Let me help you get started.
If you would like more information on my trading model or to receive my Free Weekly Trading Reports - Click Here
If you have any questions please feel free to send me an email. My passion is to help others and for us all to make money together with little down side risk.
To Your Financial Success,
By Chris Vermeulen
Chris@TheGoldAndOilGuy.com
Please visit my website for more information. http://www.TheGoldAndOilGuy.com
Chris Vermeulen is Founder of the popular trading site TheGoldAndOilGuy.com. There he shares his highly successful, low-risk trading method. For 6 years Chris has been a leader in teaching others to skillfully trade in gold, oil, and silver in both bull and bear markets. Subscribers to his service depend on Chris' uniquely consistent investment opportunities that carry exceptionally low risk and high return.
This article is intended solely for information purposes. The opinions are those of the author only. Please conduct further research and consult your financial advisor before making any investment/trading decision. No responsibility can be accepted for losses that may result as a consequence of trading on the basis of this analysis.
Chris Vermeulen Archive |
© 2005-2022 http://www.MarketOracle.co.uk - The Market Oracle is a FREE Daily Financial Markets Analysis & Forecasting online publication.