


Investors It Does Not Pay to Fall A Sleep During a Stocks Bull Market
Stock-Markets / Stocks Bull Market Jul 20, 2009 - 12:11 AM GMTBy: Clif_Droke

 The vast majority of retail investors have “fallen asleep” on the broad market recovery since March. The sleepy character of market psychology has become even more pronounced in just the last few weeks as the market spent some time consolidating its gains. In that period of time we’ve seen quite a few analysts turn bearish on the market, which is usually a big mistake in a year when the dominant yearly Kress cycle is up.
More than anything, we’ve heard the collective snores of traders and investors as they seem to have completely given up on the market and have gone to sleep in the proverbial sense. What happens when traders sleep through a market consolidation phase while the dominant Kress cycles (in this case the 10-year cycle) are still up? At some point the market breaks out to the upside and continues its recovery while most traders end up missing out on it because they were asleep. This is why it must be emphasized that it doesn’t pay to fall asleep in a recovery year following a major bear market.
I’m sure you’ve heard the old Wall Street bromide, “Never sell short a dull market.” That saying definitely applies in bull markets but requires some qualifying. In a confirmed bear market, like the one we experienced last year, the saying “Never sell short a dull market” definitely does not apply. In fact the opposite is true: periods of dullness and quietness in bear markets, when investors basically “fall asleep,” can be profitable opportunities for shorting the market. We saw this happen time and again last year as market dullness during the middle-to-late part of 2008 translated into falling stock prices in almost every case.
In an up cycle year, by contrast, periods of dullness allows the market digests its gains without having to pull back too deeply and correct the rally to any appreciable extent. In the process of consolidating, traders grow lazy or get tired of waiting and soon give up hope on the market’s prospects of continuing its recovery. They respond in either one of two ways: 1.) they turn bearish and sell short; or 2.) they simply become uninterested and turn their attention elsewhere, “falling asleep” as it were, and end up missing the market’s next recovery stage.
The other tried-and-true Wall Street bromide that applies here is, “A bull market always climbs a Wall of Worry.” We’ve applied this maxim to our trading stance countless times over the years, particularly during the cyclical bull market of 2003-2007 and it usually paid off. In a bear market, of course, the opposite is true since a bear market feeds on bad news and investor fears. But in a recovery phase, which is what we’re in now, the old “Wall of Worry” is rebuilt and whenever traders show too much worry or concern over corporate profits, the economy, etc., the market has a way of using this worry as a springboard to keeping the recovery alive. Once again we’ve seen this to be true since the early March bottom. The market has taken on a new character since then and has mostly shrugged off bad news and in many cases has rallied in the face of it. This is a characteristic of an up cycle year.
The longer-term NASDAQ 100 chart tells the story for the broad market recovery of 2009. NDX has broken out of a multi-month trading range and overcame a key resistance at the 1,500 level this week. Leadership from the tech sector is what we want to see in a recovery phase where the major Kress cycles are still up. The market has earned a well earned respite after last week’s blow out performance on the back of rising interim internal momentum, to say nothing of earnings surprises. Yet the psychology indicators (discussed below) are strong enough to support the market through its next pullback and keep the recovery uptrend intact.
Earnings season is in full swing and so far a substantial percentage of companies reporting quarterly earnings have been upside surprises. According to Zacks Investment Research, quarterly earnings upside surprises are beating downside surprises by a 7 to 1 ratio. Leading the latest surge of earnings surprises on Wednesday was Intel, which announced better-than-expected adjusted earnings of $0.18 per share in its latest quarter.
Add to that list IBM, which experienced an explosive rally this week to new recovery highs. Big Blue was up almost every day this week in a vertical rise that puts its stock price at a 10-month high. As we’ve talked about in past reports, IBM is one of our favorite leading indicator stocks for the broad market.

Even more than IBM, I was especially gratified to see the impressive performance in Fed-Ex (FDX) this week. FDX is one of the most economically sensitive stocks on the NYSE and as such it’s a key indicator for U.S. retail economic performance. In spite of a down earnings report, FDX broke out on high volume on Thursday by nearly $4/share in a show of strength. The rally in FDX helped push our New Economy Index (NEI) higher this week as we’ll see here.
weakness of the so-called “New Economy” of the U.S. retail sector. They are: Amazon.com (AMZN), Wal-Mart (WMT), Ebay (EBAY), Monster Worldwide (MWW) and Fed-Ex (FDX). A simple weekly average of these five stocks forms the basis of the NEI.
Using the 12-week moving average (which follows the 24-week cycle) and the 20-week MA (which tracks the 40-week cycle), we find some useful signals can come from crossovers of these two moving averages. When the 12-week MA crosses above the 20-week MA, and especially if both moving averages turn up, we get a “heads up” signal that bodes well for the interim outlook for retail sales. On the other hand, a downside crossover where the 12-week MA crosses below the falling 20-week MA typically bodes ill for the retail sales outlook. Below is the latest chart showing NEI in relation to the 12-week and 20-week moving averages.
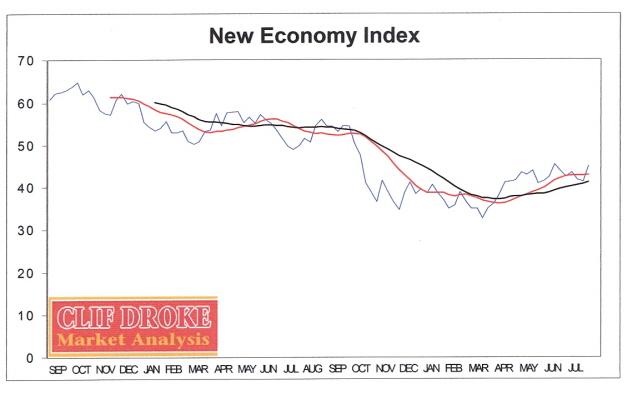
The 12-week MA has crossed above the 20-week MA and both have turned up in unison for the first time since 2007. This bodes well for the intermediate-term (6-9 month) outlook.
Supporting this economic improvement is the latest Initial Unemployment Claims data, courtesy of Briefing.com.
In another sign that the financial crisis is abating, credit card providers American Express and Capital One Financial reported a decline in debtor delinquency rates for the month of June.
Now let’s turn our attention once again to the stock market indicators. Unbelievably, the AAII investor sentiment poll released on Thursday showed that despite the sharp rally in the broad market this week, investors are still quite bearish. The percentage of bears was 47 percent compared to only 29 percent bulls.
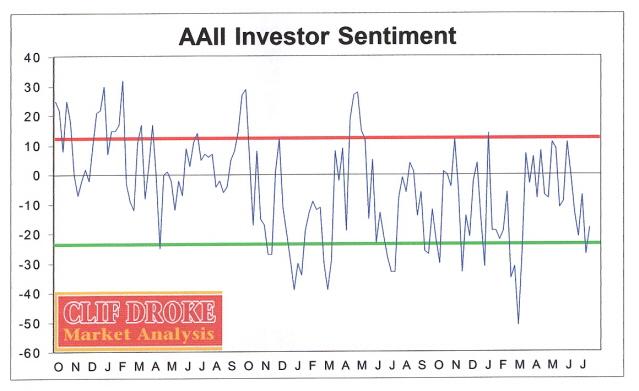
This is good news from a contrarian standpoint. Whenever investors get too bearish and the dominant yearly cycle is up, it typically bodes well for the broad market outlook. The latest investor sentiment numbers shows us that the “wall” is still very much intact.
By Clif Droke
www.clifdroke.com
Clif Droke is the editor of the daily Gold & Silver Stock Report. Published daily since 2002, the report provides forecasts and analysis of the leading gold, silver, uranium and energy stocks from a short-term technical standpoint. He is also the author of numerous books, including 'How to Read Chart Patterns for Greater Profits.' For more information visit www.clifdroke.com
Clif Droke Archive |
© 2005-2022 http://www.MarketOracle.co.uk - The Market Oracle is a FREE Daily Financial Markets Analysis & Forecasting online publication.