


Summer Stock Market and Crude Oil Trend Correction Updates
News_Letter / Financial Markets 2009 Jul 08, 2009 - 03:14 AM GMTBy: NewsLetter

The analysis of April 26th concluded that the Dow is targeting a high of 8,750 by mid May 2009 which was expected to be followed by a significant correction of 14% towards a Dow target of 7,500. The Dow hit the target on 2nd of June which was confirmed in the quick update at the time, and therefore expectations were for the significant correction to materialise.
Quick Technical Analysis - The Dow spent early June distributing along 8,800, which gave plenty of time to put on short positions with tight stops. The key chart trigger was the lower high at 8,600 which targeted a break of 8,200. The pattern size is 400 points which projects to 7,800 before the next expected bounce. The overall pattern size is about 650 which projects to 8,200 minus 650 = 7,550, which is pretty close to the original projection of April 26th for the target for the Correction AFTER the peak around 8,750. The chart is also showing an head and shoulders price pattern witch the same measuring move.
Stocks Stealth Bull Market End Probability - The probability of an end to this fledgling bull market remains very low at less than 20%, as the Dow has so far done nothing to suggest otherwise with the trend to date inline with expectations for that of a significant summer correction. The quality of the stocks bull market for the balance of the year will become clearer as the current correction unravels towards 7,500, which will enable me to generate an in depth analysis for the next 3 months or so, however existing analysis is for a 50% rally which targets Dow 9,705.
Conclusion - The Dow is still projecting towards a target of around 7,500 as indicated in the chart above, which I am sure will be taken by the perma-bears as proof that the whole move from March was just a bear market rally, JUST AT THE POINT WHERE I EXPECT THE STOCKS STEALTH BULL MARKET TO RESUME!. The in depth update to the stealth stocks bull market will follow towards the end of this month, to ensure you receive this in your email box subscribe to my always free newsletter.
Corporate Earnings - Just as I voiced days before the stock market bottomed in March, Investors / traders will need to be on their guard against the overwhelming bearish corporate earnings forecasts for 2009, as the following chart that appears quite often illustrates -
However reminding readers of what I stated in Mid March -
Wide spread consensus today exists for SHARPLY LOWER CORPORATE EARNINGS going into 2010 THAT MUST MEAN MUCH LOWER STOCK PRICES. However this earnings analysis that is so abundant today, should have been presented OVER A YEAR AGO ! in October 2007 I.e. at or near the market peak! So that ordinary investors could actually ACT on the information. NOT NOW AT THE MARKET BOTTOM ! We are again seeing REASONS as to WHY INVESTORS should avoid investing INTO the Stealth Bull market!, precisely as we all witnessed what was effectively Bullish propaganda during the final stages of the Stocks Bull Market, so we are NOW witnessing what is effectively BEARISH propaganda in the final stages of the Bear Market. Now, don't get me wrong, I am not saying that the analysis is not genuine, what I am saying is that IT IS IRRELEVANT! As it is always much easier to build a scenario in favour of a trend that has been in force for sometime that has generated much data and analysis in support of why it exists and therefore it should continue for much longer, then to "Think Out side of the Box" to disregard bearish data that has been magnified by the growing consensus that really should have been known more than a year earlier in favour of the technical picture that as the analysis of October 2008 stated, that a. we are NOT heading for a Great Depression (as I will further elaborate upon in the Q&A below) and b. The stocks bear market HAS fulfilled its bear market objectives in terms of price and time, more than anyone could have been imagined a year ago!
Make a note of these graphs as by year end everything will have been revised higher and previous corporate earnings projections conveniently forgotten, off course by that time the market will have already moved. Remember you are trading the price and NOT the earnings forecasts which are a red herring!
Trading Signals - Whilst my analysis usually tends carry clear conclusions, however I have refrained from sharing my actual trading signals to date for a number of reasons which I have touched on in past articles. Good news, I will be sharing my actual precise position trading signals for free at WalayatStreet.com i.e. buy / sell triggers, stops, and stop and reverse (SAR) points for the Dow Jones Stock Index which I have been trading for the past 23 years. WalayatStreet.com has been under development since March 2009 and will go live this month, in the meantime WalayatStreet.com continues to point to my extensive articles archive.
Recap of the Stocks Stealth Bull Market Analysis
1. Stocks Bear market Bottom forecast - 20th Jan 2009 - Target 6,600. Warning that the bear market bottom WILL be accompanied by overwhelming and highly convincing bearish fundamentals that speculators / investors will need to ignore to prevent themselves from missing out on the BOTTOM.
2. Stocks Bear Market Target Fulfilled - 8th March 2009 - Dow 6526. Preparing for a spike higher that was expected to trigger the first of a series of buy triggers to start accumulating - As you MUST WAIT for Entry Triggers, so as to give the trades a greater probability of success, and again the message to IGNORE the media / fundamentals.
3. Stocks Stealth Bull Market Born - 15th March 2009 - Dow Bear Market Bottom confirmed on multiple buy triggers during the week - Warning to ignore the fundamentals or should I say fundamentalism, bearish commentary and in many cases double speak in favour to reacting to the ACTUAL PRICE movements.
4. Stocks Stealth Bull Market Carpet Bombs the Bears - 24th March 2009 - Short-term 33% Correction, before new stealth bull market highs. End year target 50% from 6470 i.e. 9,700.
5. Stocks Stealth Bull Market Closes above Dow 8,000 - 5th April 2009 - Psychology of investing and trading. There is no point everyone seeing the rally in a the rear view mirror if FEAR kept them from monetizing on it!
6. Stealth Stocks Bull Market, Sell in May and Go Away? - 26th April 2009 - Tradable significant correction to follow from a peak around 8,750, downtrend towards Dow 7,500 over the summer.
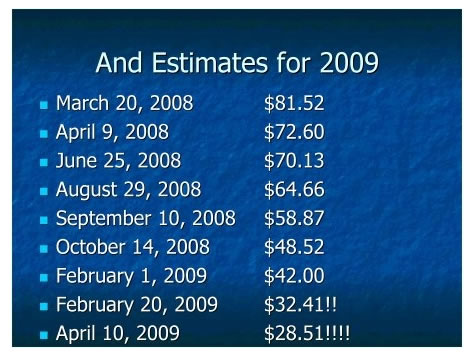
Crude Oil Forecast Summer 2009
This is a quick update to the analysis of December 2008 that projected an uptrend in the Crude Oil price into mid 2009 targeting $75, to be followed by a downtrend back below $50 towards $40 as illustrated by the original graph.
Crude Oil Summer Trend
Quick Technical Analysis - Crude oil hit its summer objective in June by peaking just shy of $74, following which it made a lower high at 73, and confirmed the downtrend on break below 66. The current action is expected to correct the bull run from $35 in December 2008, with the key consolidation zone of $47.5 to $55 which crude oil is homing in on to again form a base for the resumption of the rally into 2010. Therefore we have a price target zone of $47.50 to $55, the question now is how long will the downtrend last ? The downtrend appears to be projecting for a trend lower into late August / Early September, thereafter some sideways action could be in order before the rally gains traction later in the year.
Crude Oil Conclusion - Downtrend targeting $45 to $50 by start of September 2009, thereafter base building before the next leg higher.
The in depth update for crude oil will follow later, to ensure you receive this in your email box subscribe to my always free newsletter.
Crude Oil Mega-Trend - The long-term mega-trend is for much higher crude oil prices, we will probably see see the $200 oil price that Goldman Sachs were calling and distributing into as crude oil approached $150 last June. However as I pointed out in the analysis of December 2008 and iterated several times during the year that where oil is concerned 2009 will be the year for accumulating long-term investment position.
Therefore the trend to $45 gives long-term investors ANOTHER opportunity to accumulate into a mega-trend. Favoured routes are the oil ETF's , oil producers and explorers again spread your risk by using ETF's and investment trusts, and off course theirs Russia, a crashed stock market that has so far failed to recover despite the recent rebound in the oil price, again this would need to be a long-term exposure.
Leveraged ETF's Warning
I was going to write at depth as to why investors should steer well away from leveraged ETF's such as that for crude oil, where even if your RIGHT and the price of oil doubles as it did, you could STILL LOSE MONEY!, Leveraged ETF's should be avoided by all but ultra-short-term traders and I am talking about 1 to 3 days, any more and your trading the wrong vehicle, instead I see infuriating commentary on the internet targeting investors towards leveraged ETF's ! In my opinion THEY ARE A SCAM INVESTMENT DESIGNED TO PART YOU WITH YOUR MONEY. Short-term trading vehicle?, maybe, but Investment vehicle - NO!. Ron Rowland explained earlier in detail how they work - Understanding The Dangers of Leveraged ETF's.
Inflation / Deflation
The higher crude oil rose during the first half of 2009, the greater were the expectations for much higher inflation, in fact at the peak these tipped into many calls for hyperinflation. Now as crude oil has begun is downtrend the deflation argument has again come to the fore as the more dominant outlook.
 My own analysis in the forecast for UK inflation for 2009 as of Dec 08, forecast that UK inflation as measured by the RPI index would fall to -1.2% by mid 2009 and thereafter see a return to mild inflation by year end to target +0.8%. UK inflation hit -1.2% in April and recorded a -1.1% rate for May, which is inline with the forecast and therefore we should continue to see a gradual trend out of deflation and towards a weak +0.8% RPI inflation rate by year end.
Therefore my conclusion remains that after deflation ends in the coming months, inflation looks set to remain weak into the end of 2009 and most likely for the first half of 2010 at least. I will elaborate up on the inflation outlook and forecast for 2010 later this year.
So I do not see forward signs of either deep deflation or hyperinflation, but rather weak inflation for the next 6 to 12 months.
Economy
The falling oil price acts as a stimulus to economy so should 'eventually' be positive for the stock market, the pattern of trend of which is expected to be inline with my outlook for the stock market.
By Nadeem Walayat
http://www.marketoracle.co.uk
Copyright © 2005-09 Marketoracle.co.uk (Market Oracle Ltd). All rights reserved.
Nadeem Walayat has over 20 years experience of trading derivatives, portfolio management and analysing the financial markets, including one of few who both anticipated and Beat the 1987 Crash. Nadeem's forward looking analysis specialises on the housing market and interest rates. Nadeem is the Editor of The Market Oracle, a FREE Daily Financial Markets Analysis & Forecasting online publication. We present in-depth analysis from over 250 experienced analysts on a range of views of the probable direction of the financial markets. Thus enabling our readers to arrive at an informed opinion on future market direction. http://www.marketoracle.co.uk
Disclaimer: The above is a matter of opinion provided for general information purposes only and is not intended as investment advice. Information and analysis above are derived from sources and utilising methods believed to be reliable, but we cannot accept responsibility for any trading losses you may incur as a result of this analysis. Individuals should consult with their personal financial advisors before engaging in any trading activities.
Nadeem Walayat Archive |
© 2005-2022 http://www.MarketOracle.co.uk - The Market Oracle is a FREE Daily Financial Markets Analysis & Forecasting online publication.