


The Technical Trader Dow, Gold, Silver, Crude Oil & Nat Gas Charts
Commodities / Commodities Trading Jul 05, 2009 - 04:19 PM GMTBy: Chris_Vermeulen

 The technical trader looks at the market much differently than most. While many investors are confused when looking at charts which have been marked up by a technician, more experienced traders look at these charts as a map. Short term financial charts are riddles/maps allowing us to put all the pieces together creating a conclusion on how to profit in the near future.
While there are hundreds of indicators, I focus on a handful which has proven to work extremely well together. The fewer the indicators the more simple trading becomes, allowing me to focus on money management and my trading psychology instead of the charts.
Indicators I focus on in order of importance for ETF trading only:
- Price action (Candles Sticks)
- Trend lines
- Momentum (MACD)
- Price performance (against the underlying commodity & its stocks)
- Stochastic Indicator
- Volume
Ok, let’s get to the charts. When I look at charts I can see these patterns naturally. The reason I draw on them is to show you what I am seeing. This is the best way for learning to become a technical trader. You should read some books on chart patterns and Japanese candle sticks but after that, it comes down to watching charts unfold in real-time.
July Special - Save $49 & Get JT Grenough's Crisis Investing E-book Free with membership |
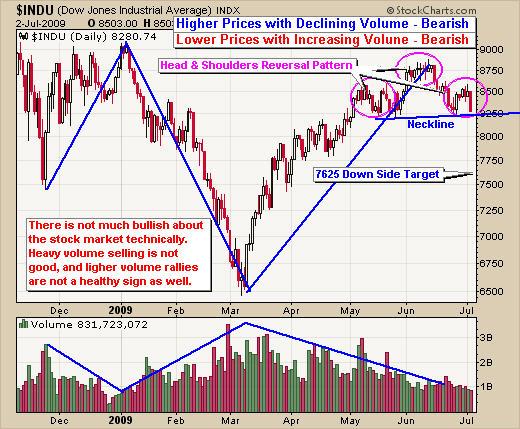
Dow Jones Industrial Average – US Stock Market Index
This is a chart I put together which clearly shows that we are still in a bear market. Nothing on this chart is bullish for the intermediate term view (2-8 weeks). Short term we are near support and we could see a bounce Monday, but overall we are seeing bearish price action. The high volume selling and low volume rallies are warning the technical trader to protect his positions with hedges or stops.
Also you can see the stocks have formed a short term head & shoulders pattern which is pointing to much lower prices on the Dow (DJIA). This is a very reliable chart pattern which is why I am pointing it out to you.
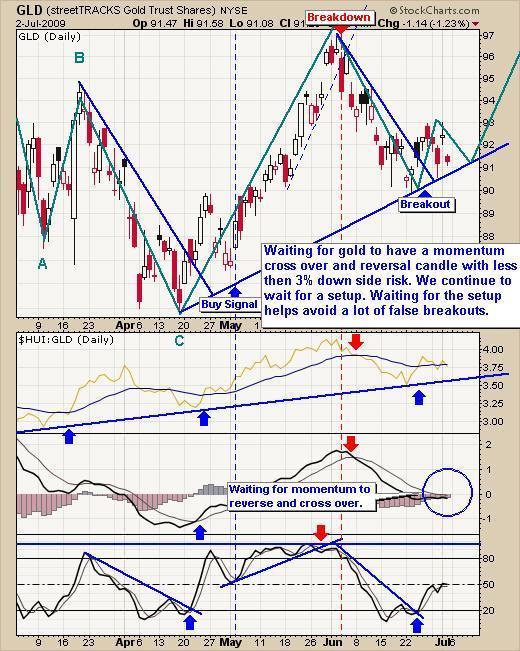
GLD Fund – The Technical Trader Price Action Chart for Gold
Gold looks to be setting up for another move higher, if all goes well. Currently the price broke its blue downward trend line and now we are waiting for the momentum to turn up which will put the odds more in our favor. Gold stocks are performing well and with any luck the drop in the stock market will send buyers into gold. I continue to wait for a low risk setup before taking a position in gld (gold bullion).
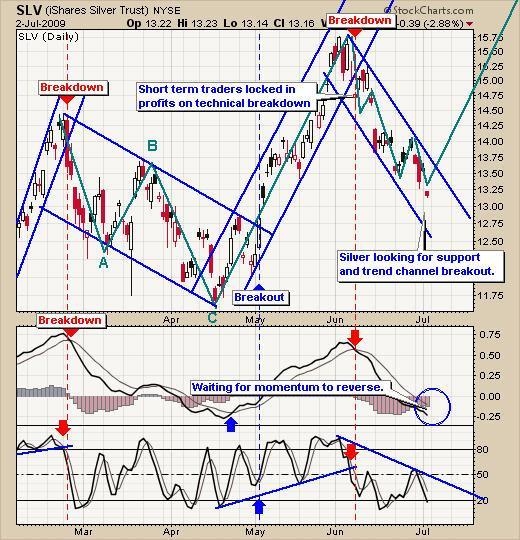
SLV Fund – The Technical Trader Price Action Chart for Silver
Silver continued to slide lower last week and that is because it is not seen as much as a safe haven like it’s big sister GOLD. While informed traders know its value the average Joe does not think to buy silver, they focus on buying gold simply because of the lack of education on their end. Silver can provide massive gains but it does require more risk and skill for locking in gains because of it’ volatility. It does not always move with the price of gold.
Currently we are waiting for silver to reverse and generate a buy signal.
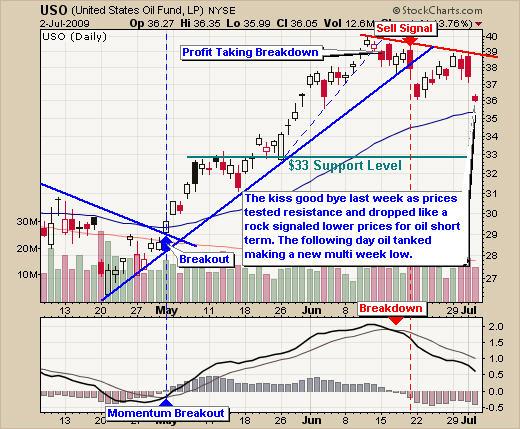
USO Fund – The Technical Trader Price Action Chart for Oil
Oil is sliding lower technically speaking. Support trend lines were broken a few weeks back taking us out of any energy trades. Last week I pointed out the testing of the $39 level at which point sellers stepped in and pointed out that oil was going to have some downward pressure in the near term. The following day oil dropped like a rock as expected.
I did not point out the head & shoulders pattern in oil. If you look at the Dow chart’s head & Shoulder and then back to his chart, you will see the pattern clearly. The neckline was broken on Thursday and that is telling me we could see $33 as the next major support level.
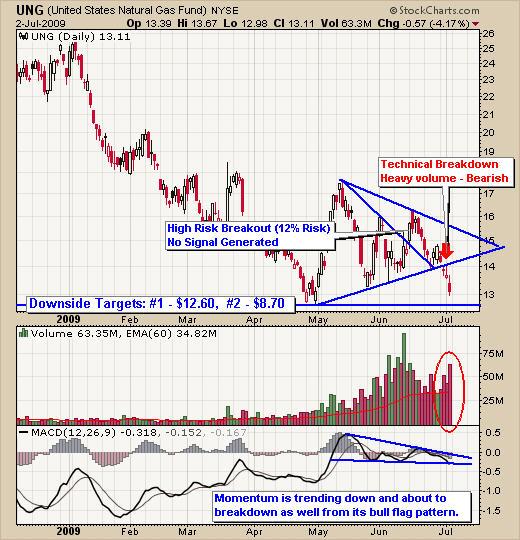
UNG Fund – The Technical Trader Price Action Chart for Natural Gas
Natural gas broke down last week on rising volume. This is telling me that the traders who bought early anticipating the reversal to the upside are bailing out to cutting their losses. This is the exact same thing which USO did before it reversed. I provided the charts last week on this if you want to read more about it.
Anyways this breakdown will flush out the majority of traders and once that is finished prices will reverse and head higher in my opinion. We could see prices drop substantially from here which you can see from my chart below. Traders, who are long, hold on tight!
The Technical Trader Conclusion:
From looking at the Dow chart, stocks are at a short term support level. We could see prices put in a small bounce and trend sideways for a week or two still. But overall it looks like stocks are headed lower. I do not predict price, but I like to point out which way the odds are headed and what to expect if prices follow through with current supply and demand levels. I am very cautious on my long trades at this point moving my stops higher to lock in gains incase the market tanks again this week.
Gold is finding support at the current level but until we get some upside momentum I do not want to take a position.
Silver is still under pressure but looks ready for some sideways price action at this level as it decides which way to go.
Oil appears to be starting a waterfall sell off. Because so many traders are watching and playing oil now, I figure this breakdown will send oil plummeting quickly. At this time I see the $33 level as my first down side target which is a measured move from the head & shoulders pattern and also a previous support level.
Natural gas looks to be starting another leg down. I continue to wait for buy signal for this commodity as I am not jumping on the short side at this time. I may take a short position if I get a nice short setup in the near future.
Hello, I'm Chris Vermeulen founder of TheGoldAndOilGuy and NOW is YOUR Opportunity to start trading GOLD, SILVER & OIL for BIG PROFITS. Let me help you get started.
If you would like more information on my trading model or to receive my Free Weekly Trading Reports - Click Here
If you have any questions please feel free to send me an email. My passion is to help others and for us all to make money together with little down side risk.
To Your Financial Success,
By Chris Vermeulen
Chris@TheGoldAndOilGuy.com
Please visit my website for more information. http://www.TheGoldAndOilGuy.com
Chris Vermeulen is Founder of the popular trading site TheGoldAndOilGuy.com. There he shares his highly successful, low-risk trading method. For 6 years Chris has been a leader in teaching others to skillfully trade in gold, oil, and silver in both bull and bear markets. Subscribers to his service depend on Chris' uniquely consistent investment opportunities that carry exceptionally low risk and high return.
This article is intended solely for information purposes. The opinions are those of the author only. Please conduct further research and consult your financial advisor before making any investment/trading decision. No responsibility can be accepted for losses that may result as a consequence of trading on the basis of this analysis.
Chris Vermeulen Archive |
© 2005-2022 http://www.MarketOracle.co.uk - The Market Oracle is a FREE Daily Financial Markets Analysis & Forecasting online publication.