


Seasonal Factors Influence Summer Stock Market Trend
Stock-Markets / Stock Index Trading Jun 23, 2009 - 11:48 AM GMTBy: Guy_Lerner

 As we wind our way into the summer duldrums, much has been written of seasonal factors. "Sell in May and go away" is an often heard refrain, and this bit of market lore suggests market underperformance during the summer months and early fall. Like most things market related, there is some truth to this dogma, but of course, there are always exceptions.
So let's design a study that emulates the "sell in May and go away" strategy. But for our purposes, we will "buy" the S&P500 on April 30 and "sell" our position on October 30. This is the opposite of the "sell in May and go away" strategy.
Since 1961, such a strategy actually lost 157 S&P500 points. 31 of your 48 trades were winners. Over this time, buy and hold S&P500 netted 830 S&P500 points. On the surface, market timers who use seasonal factors appear to have it correct. Why be in the market during the next 5 months when you don't make money?
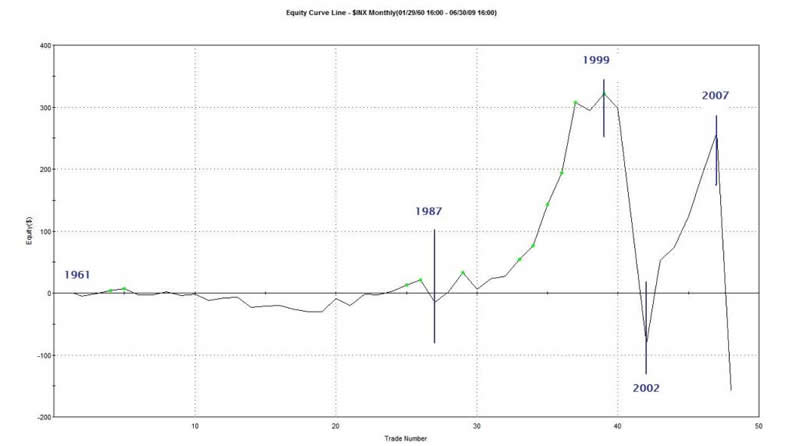
Now let's look at the equity curve from our above strategy where we bought in May and held through October. See figure 1. From 1987 through 1999 and from 2002 through 2007, buying in May and selling in October actually was a pretty good strategy. These two periods alone would have netted about 600 S&P500 points, and such returns, relative to buy and hold, would make many question the validity of the seasonal strategy of selling in May. Of course, the two periods highlighted -where seasonals didn't matter - were part of a bull market.
Figure 1. Equity Curve
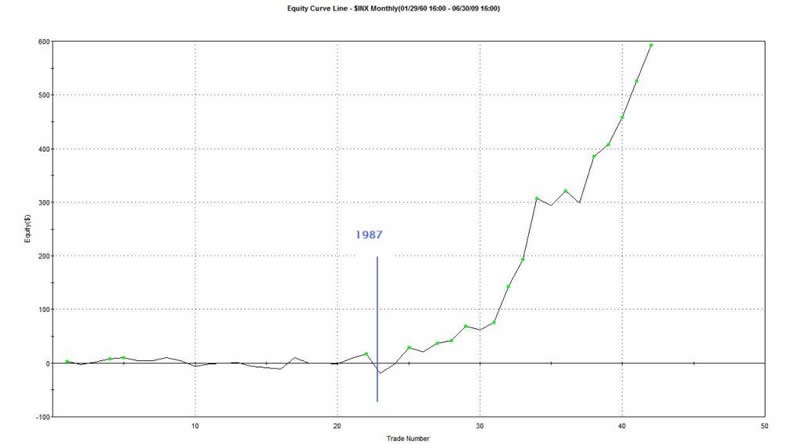
So do seasonal factors only work in certain kinds of markets? It appears so. If we buy the S&P500 in May and sell in October only when the 10 month moving average (i.e., equivalent to 200 day moving average) is rising, we get the equity curve shown in figure 2. In this instance, we are buying the seasonally negative period when we are in a bull market (i.e., rising 10 month moving average). Such a strategy yields almost 600 S&P500 points on 42 trades since 1961. The strategy is a bit bipolar in the sense that it works best post 1987.
Figure 2. Equity Curve
Bottom line: with the 10 month moving average still heading down on the S&P500, it would seem that seasonal factors of "sell in May and go away" are likely to have a negative effect on share prices.
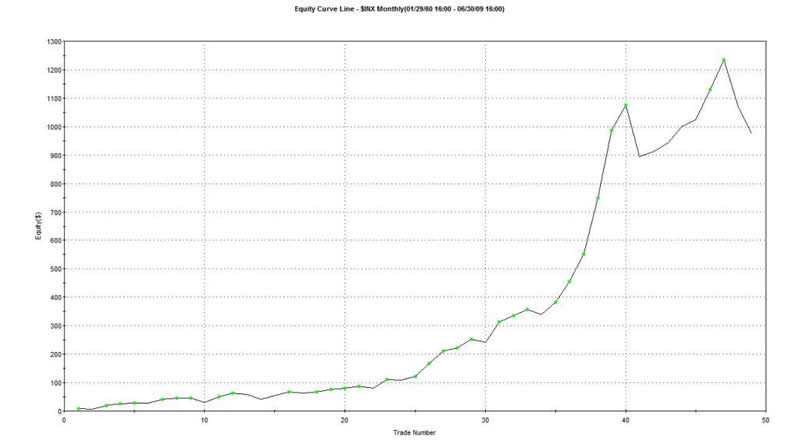
Lastly and for the record, let's get it right, and in this case we will "buy" the S&P500 on October 30 and "sell" on April 30. Since 1961, such a strategy generated 975 S&P500 points, which exceeds buy and hold. 74% of the trades were positive and the equity curve for such a strategy is shown in figure 3.
Figure 3. Equity Curve
By Guy Lerner
http://thetechnicaltakedotcom.blogspot.com/
Guy M. Lerner, MD is the founder of ARL Advisers, LLC and managing partner of ARL Investment Partners, L.P. Dr. Lerner utilizes a research driven approach to determine those factors which lead to sustainable moves in the markets. He has developed many proprietary tools and trading models in his quest to outperform. Over the past four years, Lerner has shared his innovative approach with the readers of RealMoney.com and TheStreet.com as a featured columnist. He has been a regular guest on the Money Man Radio Show, DEX-TV, routinely published in the some of the most widely-read financial publications and has been a marquee speaker at financial seminars around the world.
© 2009 Copyright Guy Lerner - All Rights Reserved
Disclaimer: The above is a matter of opinion provided for general information purposes only and is not intended as investment advice. Information and analysis above are derived from sources and utilising methods believed to be reliable, but we cannot accept responsibility for any losses you may incur as a result of this analysis. Individuals should consult with their personal financial advisors.
Guy Lerner Archive |
© 2005-2022 http://www.MarketOracle.co.uk - The Market Oracle is a FREE Daily Financial Markets Analysis & Forecasting online publication.