UK House Prices Rise for Second Time in Three Months
Housing-Market / UK Housing Jun 07, 2009 - 11:44 AM GMTBy: Nationwide
 • House prices rose by 1.2% in May
• Annual rate of decline improves sharply from -15.0% to -11.3%
• Low supply levels may explain some of the improvement in price trends

* seasonally adjusted
Commenting on the figures Martin Gahbauer, Nationwide's Chief Economist, said: “The price of a typical house rose by 1.2% in May, providing further evidence of some improvement in housing market conditions over the last few months. At £154,016, the average house price is still 11.3% lower than a year ago, although this marks a significant improvement from the annual decline of 15.0% recorded in April. The 3 month on 3 month rate of change – a smoother indicator of short-term price trends – rose from -3.0% in April to -0.5% in May and now stands at its highest level since January 2008.
“Although the short-term trend in house prices has clearly improved from where it was at the beginning of the year, it is still too early to say that the market is turning definitively. During the downturn of the early 1990s, there were many months during which prices rose, only to fall back down again in subsequent periods. In the current downturn, the combination of rapidly rising unemployment and tight access to credit implies that the last of the price declines has probably not been seen yet. Nonetheless, the improvement in house price trends is consistent with signs of stabilisation in several other economic indicators and suggests that any further price declines may occur at a less rapid pace than in 2008.
Supply dynamics may explain some of the recent improvement in house price trends
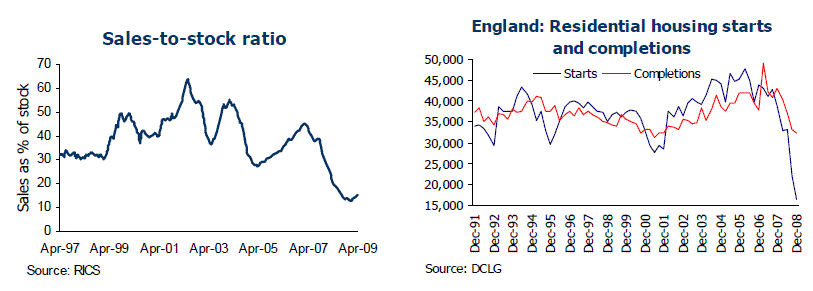
“The movement of house prices ultimately depends on the balance of demand and supply of houses on the market. One timely indicator of the supply-demand balance is the ratio of sales to unsold stock, published monthly by the Royal Institution of Chartered Surveyors. For most of 2008, this measure was on a steady declining trend, consistent with the acceleration of house price falls as the year progressed. Although it remains at a very low level by historical standards and continues to point to further house price declines, the ratio has recently stabilised somewhat and this probably explains some of the improvement in price trends over the last few months.

“It is not yet certain, however, whether the sales-to-stock ratio will rise on a more sustained basis over the coming months. House sales still remain close to record lows, so that the improvement in the supply-demand balance is so far mostly attributable to a decline in the stock of property on estate agents’ books. There are several possible reasons why stock levels are falling. First, the rate at which additional property is coming onto the market could be lower than the rate of sales.
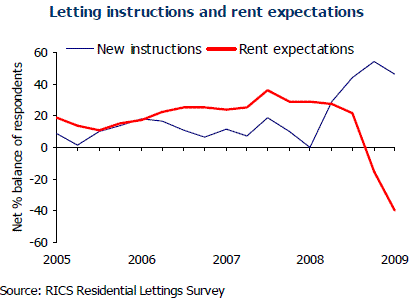
This may be the case if many potential sellers are holding back from putting their homes on the market for fear of not being able to obtain their desired price in the current economic conditions, or if few new homes are being built. The latter is certainly the case, as builders have retrenched and housing starts have reached all-time record lows. Second, unsold stock levels could fall if existing sellers give up and withdraw their properties from the sales market, either by letting them out or choosing not to move for the time being. Recent anecdotal evidence suggests that there has been a large rise in sellers choosing to let their properties instead of holding out for a buyer, which could explain at least part of the fall in stock levels.
 “While supply dynamics in the market have all been exerting downward pressure on stock levels, there are reasons to believe that this trend is unlikely to continue in the long run. Potential sellers of existing homes who had previously delayed the listing of their property may not be able to wait indefinitely, particularly if they have seen a loss of income due to the deteriorating labour market situation.
The recent widely reported increases in new buyer enquires may also encourage more of these reluctant sellers to test the market in the coming months. Moreover, the surge in “reluctant landlords” has increased the supply of property in the rental market and pushed down on surveyors’ expectations of achievable rents, making it more difficult for existing sellers to pursue the option of letting their properties out if they can’t sell. Trends in the rental market and their potential impact on supply levels in the sales market will, therefore, be worth watching closely.
“If the supply of homes onto the market does increase, the recent moderation in the pace of house price falls may not be sustained. However, the ultimate outcome for prices depends as much on the development of demand as it does on supply dynamics. Survey evidence suggests that buyer interest has picked up strongly in response to lower prices and lower interest rates. If this buyer interest translates into actual sales and outweighs any potential increases in supply, then the recent moderation in price falls may continue. For the moment, however, it is unclear how the balance between supply and demand will ultimately work through in the coming months.”
| Fionnuala Earley Chief Economist Tel: 01793 656370 fionnuala.earley@nationwide.co.uk |
Roy Beale Media Relations Officer Tel: 01793 655689 roy.beale@nationwide.co.uk |
Notes: Indices and average prices are produced using Nationwide's updated mix adjusted House Price Methodology which was introduced with effect from the first quarter of 1995. Price indices are seasonally adjusted using the US Bureau of the Census X12 method. Currently the calculations are based on a monthly data series starting from January 1991. Figures are recalculated each month which may result in revisions to historical data. The Nationwide Monthly House Price Index is prepared from information which we believe is collated with care, but no representation is made as to its accuracy or completeness. We reserve the right to vary our methodology and to edit or discontinue the whole or any part of the Index at any time, for regulatory or other reasons. Persons seeking to place reliance on the Index for their own or third party commercial purposes do so entirely at their own risk. All changes are nominal and do not allow for inflation. More information on the house price index methodology along with time series data and archives of housing research can be found at www.nationwide.co.uk/hpi
Nationwide Archive |
© 2005-2022 http://www.MarketOracle.co.uk - The Market Oracle is a FREE Daily Financial Markets Analysis & Forecasting online publication.


