


False New Stocks Bull Market Signal From Coppock Curve Indicator?
Stock-Markets / Stocks Bear Market Jun 02, 2009 - 08:48 AM GMTBy: Guy_Lerner

 I am seeing several articles in the main stream press and blogosphere regarding the "bullish signal" given by a technical indicator known as the Coppock Guide or Coppock Curve. As we can see in figure 1, a monthly chart of the Dow Jones Industrial Average (symbol: $DJIA), the Coppock Guide has turned up from a very low level. Thus according to the above referenced sources, this indicates a new bull market.
I am not so sure about that interpretation.
Figure 1. $DJIA/ monthly
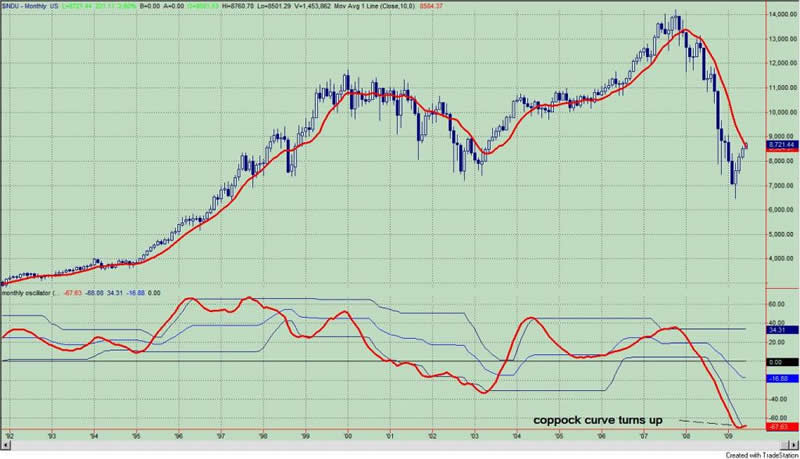
Let's take a look at the indicator which was developed by E.S.C. Coppock and presented in Barron's in 1962 as a very long term buying guide. Coppock advised buying stocks when the indicator was below the zero and then turned up. The formula that I use to calculate the Coppock guide is:
1) use monthly data
2) use closing prices
3) calculation A: 14 month rate of change
4) calculation B: 11 month rate of change
5) summation of: (calculation A + calculation B)
6) take the 10 month weighted moving of the value in line 5
In TradeStation Easy Language code this looks like:
(WAverage((RateofChange(C,14) + RateofChange(C,11)),10))
My Coppock indicator, as presented in figure 1, is then wrapped in trading bands with a 36 bar look back period (or 3 year) to assess for extremes in the data.
In the one article that analyzes the current buy signal the author writes:
"Valid signals are those that turn up from under the zero line. And historically, the deeper the level at which the signal arrives, the more strength the following bull market has. This most recent signal is coming from a deeply oversold level - the most since 1938 (-417 to -400) and even further, 1932 (-643 to -616)."
This is a true statement. However, in the article the author is utilizing the S&P500 Index, which was not in existence until 1957, so one must assume that the data from 1920 to 1957 is the synthetic index that linked the S&P90 (pre 1957) with the S&P500 (post 1957).
More importantly, if we use a differernt (but similar) data set, like the Dow Jones Industrial Average, we get very different results. For example, in 1931 there were two deeply oversold signals (using DJIA data), when the Coppock indicator value was actually at or below the current and 1938 levels of the indicator. The first turn up of the Coppock Curve was in February, 1931, and the Dow closed at 190.30. The second turn up of the Coppock Curve was in August, 1931 with the Dow at 139.40. In both cases, the indicator turned down 1 month later, and the ultimate low was at Dow 40.60. Ouch!
Furthermore, the deeper the oversold level doesn't necessarily equate to a strong bull market once the indicator turns. Following the 1938 signal, the Dow only went about 15% higher before rolling over.
The author does acknowledge that "the Coppock Curve has given its share of false signals", but I am not sure what he means when he states that "we haven’t seen any (false signals) occur when the metric has curled up from such a deeply negative level." I know I have only shown you these two very, very oversold signals from the Dow in 1931, but very, very oversold didn't work for the Nikkei in the 1990's or for gold in the 1980's and 1990's either.
I have "sliced and diced" the Coppock Curve many ways and found that it does have some merit of identifying trend momentum. For example, if you buy the DJIA when the Coppock Guide is rising and sell when it is falling you get an equity curve that looks like figure 2.
Figure 2. Equity Curve
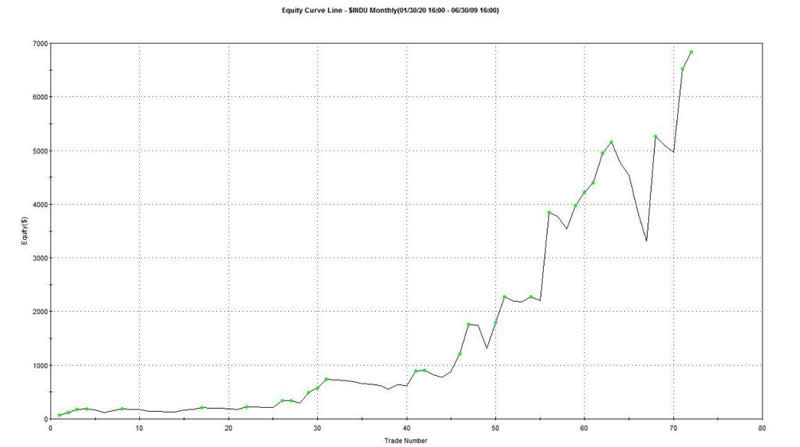
Since 1924, such a strategy yielded 6830 DJIA points versus buy and hold of 8600 DJIA points. There would have been 72 trades of which 50% were profitable; your time in the market was 47%. The strategy draw down is about 40%, which is not much of an improvement over buy and hold. From this study and by following the Coppock Guide, you can make 80% of buy and hold with approximately 50% market exposure, but it doesn't improve draw down over buy and hold.
My impression is that the Coppock indicator functions like most oscillators. They are great in a range bound market (like the 1960's); I don't believe they are very useful in an oversold or overbought market. Across multiple markets and in the Dow, there appears to be nothing unique about the Coppock Curve to indicate the onset of a new bull market.
By Guy Lerner
http://thetechnicaltakedotcom.blogspot.com/
Guy M. Lerner, MD is the founder of ARL Advisers, LLC and managing partner of ARL Investment Partners, L.P. Dr. Lerner utilizes a research driven approach to determine those factors which lead to sustainable moves in the markets. He has developed many proprietary tools and trading models in his quest to outperform. Over the past four years, Lerner has shared his innovative approach with the readers of RealMoney.com and TheStreet.com as a featured columnist. He has been a regular guest on the Money Man Radio Show, DEX-TV, routinely published in the some of the most widely-read financial publications and has been a marquee speaker at financial seminars around the world.
© 2009 Copyright Guy Lerner - All Rights Reserved
Disclaimer: The above is a matter of opinion provided for general information purposes only and is not intended as investment advice. Information and analysis above are derived from sources and utilising methods believed to be reliable, but we cannot accept responsibility for any losses you may incur as a result of this analysis. Individuals should consult with their personal financial advisors.
Guy Lerner Archive |
© 2005-2022 http://www.MarketOracle.co.uk - The Market Oracle is a FREE Daily Financial Markets Analysis & Forecasting online publication.