


Strong Silver Rally Within Overall Bear Market
Commodities / Gold & Silver 2009 May 21, 2009 - 11:43 AM GMTBy: Roland_Watson

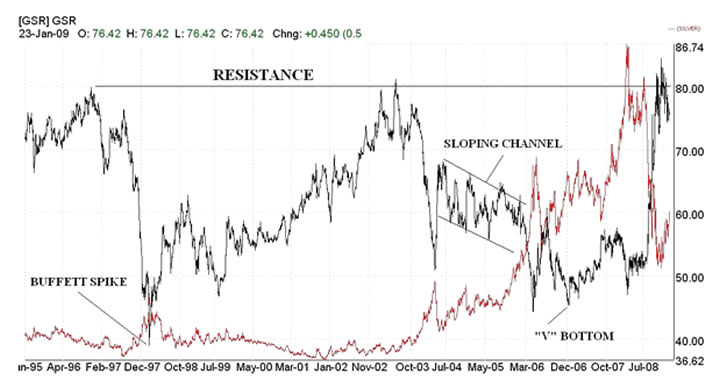
 Back in February I had a look at the gold-silver ratio and suggested silver was looking overbought in terms of the ratio using a 10 year chart. I reproduce that chart below to refresh memories.
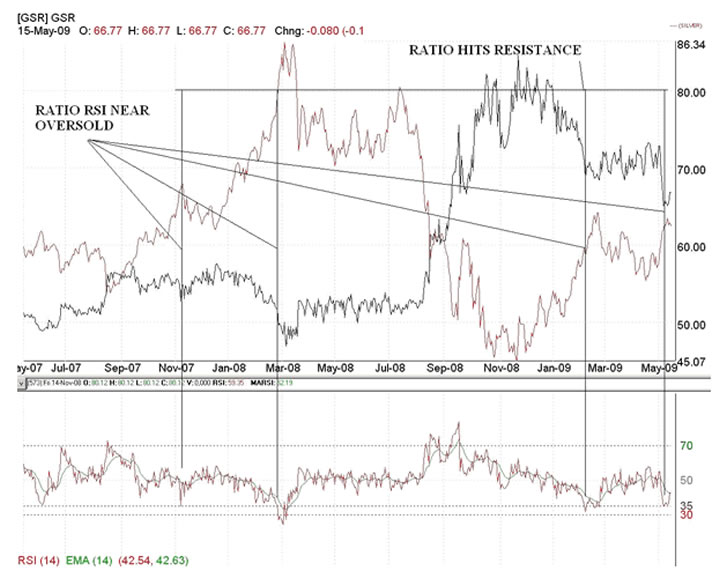
If we now update that chart further down and zoom in on that ratio, the bearish sentiments turned out to be true as about two weeks after that original article in February; silver topped at about $14.50 and has been in a mini-bear for 3 months now. The ratio dropped to a low of 65 last week and has drifted a bit since then. Can we say that silver has put in a bottom based on the current ratio valuation?
Probably not in the short to medium term and one other interesting fact about the gold-silver ratio sheds some light on that suggestion. At a venture, I pulled up the RSI technical indicator for the ratio. Now the RSI is a very useful technical indicator but since the gold-silver ratio is itself a kind of technical indicator, would a technical indicator of a technical indicator just throw up nonsense?
It didn't as it turned out. Note my annotations for the price of silver when the RSI of the gold-silver ratio approached the oversold levels (35 and under). For the last two years anyway, when that 35 or under level was reached a decent (or even mega) top in silver was imminent. In fact, it gave a two day warning before the November 9th 2007 top, one week before the March 2008 top (based on the highest closing price), two weeks before the Feb 2009 high and now it has hit that 35 RSI level again on the 7th and 12th May. That implies to me that the price action for silver is going to be choppy in the short to medium term (though we are bullish going into the summer).
I recommend this GSR RSI approach as a useful addition to the gold and silver investor's toolbox but only in the context of other metrics (some of which I make available to subscribers). Let me wrap this up by saying that silver is still in an overall bear market since March 2008. Previous corrections after silver price spikes in 2004 and 2006 suggest silver will not decisively take out its $21 high for a while yet but nevertheless, the ongoing rally since November 2008 is not over yet and in that sense we remain bullish into the new few months.
By Roland Watson
http://silveranalyst.blogspot.com
Further analysis of the SLI indicator and more can be obtained by going to our silver blog at http://silveranalyst.blogspot.com where readers can obtain the first issue of The Silver Analyst free and learn about subscription details. Comments and questions are also invited via email to silveranalysis@yahoo.co.uk .
Roland Watson Archive |
© 2005-2022 http://www.MarketOracle.co.uk - The Market Oracle is a FREE Daily Financial Markets Analysis & Forecasting online publication.