


Effect of Household Debt Deleveraging on Housing, Consumption and the Stock Market
Economics / US Debt May 19, 2009 - 07:22 PM GMTBy: Mike_Shedlock

 Inquiring minds are investigating the Federal Reserve Bank of San Francisco report on Household Deleveraging and Future Consumption Growth.
U.S. household leverage, as measured by the ratio of debt to personal disposable income, increased modestly from 55% in 1960 to 65% by the mid-1980s. Then, over the next two decades, leverage proceeded to more than double, reaching an all-time high of 133% in 2007. That dramatic rise in debt was accompanied by a steady decline in the personal saving rate. The combination of higher debt and lower saving enabled personal consumption expenditures to grow faster than disposable income, providing a significant boost to U.S. economic growth over the period.
In the long-run, however, consumption cannot grow faster than income because there is an upper limit to how much debt households can service, based on their incomes. For many U.S. households, current debt levels appear too high, as evidenced by the sharp rise in delinquencies and foreclosures in recent years. To achieve a sustainable level of debt relative to income, households may need to undergo a prolonged period of deleveraging, whereby debt is reduced and saving is increased.
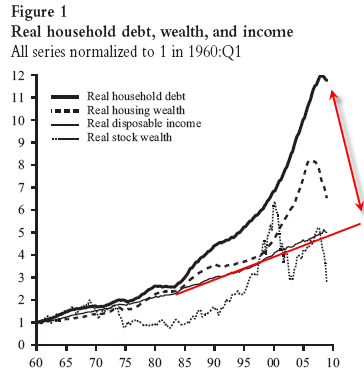
Notice the enormous gap between debt and income. This gap will be filled by deleveraging (increased savings), by default, or a combination of both. Either way, given consumer spending is close to 70% of the economy, it is irrational to expect the stock market to come roaring back anytime soon.
Can it get worse? Yes, unfortunately it can. Ponder the implications if wage growth deviates negatively from the long term trend for a sustained period of time.
Going forward, downward pressure on debt is likely to come from both lenders and households. On the supply side, tighter lending standards will require more income, collateral, and documentation for any given loan. Demand for mortgage debt could also wane as expectations of future house price appreciation are adjusted downward to reflect market conditions. Concerns about future job security and the risk of foreclosure or bankruptcy may spur consumers to boost their precautionary saving. Moreover, the need to rebuild nest eggs held for college education or retirement may prompt consumers to shift toward a more saving-oriented lifestyle.
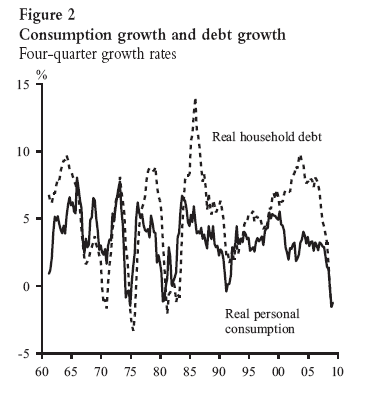
Figure 2 shows that real consumption and real debt growth have been strongly correlated since 1960. Rapid debt growth allowed consumption to grow faster than income. Conversely, if households were to go through a sustained period of deleveraging (negative debt growth), then consumption growth would be expected to slow.
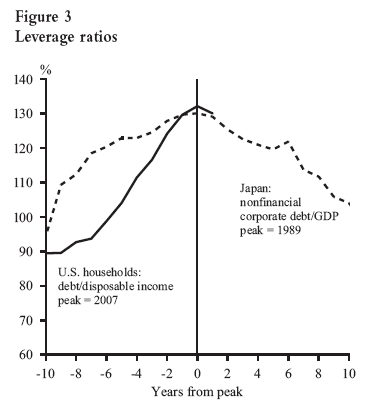
Figure 3 compares Japan's nonfinancial corporate sector with the U.S. household sector over 10-year periods before and after the leverage-ratio peaks. In both countries, leverage ratios rose rapidly in the years before the peak.
After Japan's bubbles burst, private nonfinancial firms undertook a massive deleveraging, reducing their collective debt-to-GDP ratio from 125% in 1991 to 95% in 2001. By reducing spending on investment, the firms changed from being net borrowers to net savers. If U.S. households were to undertake a similar deleveraging, their collective debt-to-income ratio would need to drop to around 100% by year-end 2018, returning to the level that prevailed in 2002.
Let's now consider the effect of consumer and corporate deleveraging on the stock market.
Nikkei Stock Index 1980-Present
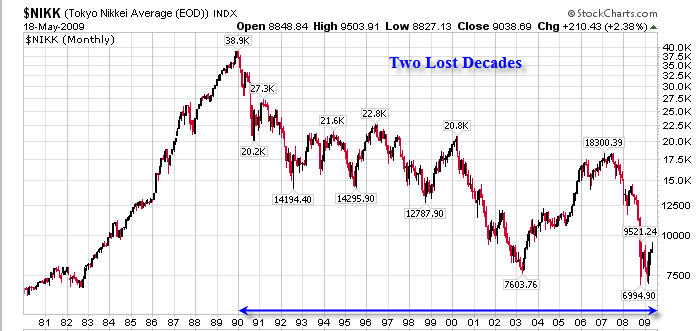
A look at the Nikkei shows that Japan has already lost two decades since the peak in 1990. It is likely the US follows the same general pattern.
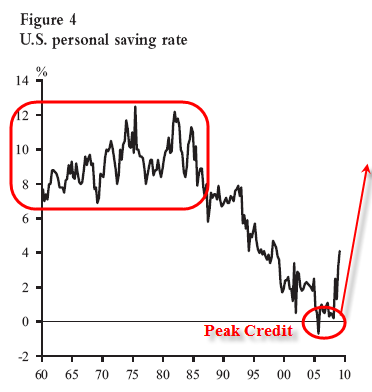
Figure 4 shows that the U.S. personal saving rate has recently started to increase following a decades-long decline that bottomed out near zero in 2005. As described in Lansing (2005), the secular decline in the saving rate appears to have been driven, at least in part, by long-lived bull markets in stocks and housing. The recent price declines in these markets might therefore initiate a sustained rebound in the saving rate over time.
Going forward, it seems probable that many U.S. households will reduce their debt. If accomplished through increased saving, the deleveraging process could result in a substantial and prolonged slowdown in consumer spending relative to pre-recession growth rates. Alternatively, if accomplished through some form of default on existing debt, such as real estate short sales, foreclosures, or bankruptcy, deleveraging could involve significant costs for consumers, including tax liabilities on forgiven debt, legal fees, and lower credit scores. Moreover, this form of deleveraging would simply shift the problem onto banks that hold these loans as assets on their balance sheets. Either way, the process of household deleveraging will not be painless.
Peak Credit and Peak Earnings
Not long ago, the US was once a nation of savers. Now that the housing bubble has crashed and the stock market along with it, the US is poised to become a nation of savers again.
Peak Credit and her twin sister Peak Earnings have arrived. Here is a snip from the former.
... That final wave of consumer recklessness created the exact conditions required for its own destruction. The housing bubble orgy was the last hurrah. It is not coming back and there will be no bigger bubble to replace it. Consumers and banks have both been burnt, and attitudes have changed.
It took nearly 80 years for people to get as reckless as they did in 1929. 80 years! Few are still alive that went through the great depression. No one listened to them. That is the nature of the game. The odds of a significant bout of inflation now are about the same as they were in 1929. Next to none.
Children whose parents are being destroyed by debt now, will keep those memories for a long time.
Think the US stock market is going to come roaring back if consumer deleveraging plays out as it must? Think again.
Expect another "Lost Decade" when it comes to housing and the stock market. It's the deflationary payback for the greatest credit binge in world history.
By Mike "Mish" Shedlock
http://globaleconomicanalysis.blogspot.com
Click Here To Scroll Thru My Recent Post List
Mike Shedlock / Mish is a registered investment advisor representative for SitkaPacific Capital Management . Sitka Pacific is an asset management firm whose goal is strong performance and low volatility, regardless of market direction.
Visit Sitka Pacific's Account Management Page to learn more about wealth management and capital preservation strategies of Sitka Pacific.
I do weekly podcasts every Thursday on HoweStreet and a brief 7 minute segment on Saturday on CKNW AM 980 in Vancouver.
When not writing about stocks or the economy I spends a great deal of time on photography and in the garden. I have over 80 magazine and book cover credits. Some of my Wisconsin and gardening images can be seen at MichaelShedlock.com .
© 2009 Mike Shedlock, All Rights Reserved
Mike Shedlock Archive |
© 2005-2022 http://www.MarketOracle.co.uk - The Market Oracle is a FREE Daily Financial Markets Analysis & Forecasting online publication.