


Stock Market Counter Trend Top of Undetermined Magnitude
Stock-Markets / Stocks Bear Market May 17, 2009 - 08:11 PM GMTBy: Andre_Gratian

 Current Position of the Market
SPX: Long-term trend - Down! The very-long-term cycles have taken over and if they make their lows when expected, the bear market which started in October 2007 should continue until 2012-2014. This would imply that much lower prices lie ahead.
SPX: Intermediate trend - On March 6, the index started a counter-trend rally of a corrective nature followed by a pause in the trend. We have reached a top, the nature of which is still undetermined, but more corrective action is expected.
Daily market analysis of the short term trend is reserved for subscribers. If you would like to sign up for a FREE 4-week trial period of daily comments, please let me know at ajg@cybertrails.com .
Overview:
In the last newsletter, I gave a dozen reasons why the stock market could be vulnerable to a correction, and asked the rhetorical question: Is the market a buy or a sell? The answer was: "SELL!"
That was the right conclusion! The SPX is down about 50 points from the high which was made at 930.17 on 5/08, and although some short-term divergences are appearing in the hourly indicators and that we might soon get a short-term rally, it does not look as if the decline is over.
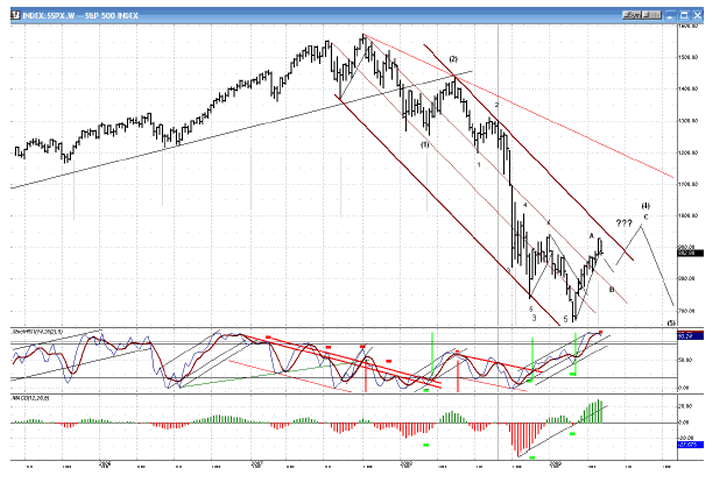
At this stage, it is a little difficult to determine exactly where we stand in the intermediate market position. Most of the EW analysts are still looking for an intermediate wave (5) and some, including myself, are wondering if this is what we may have just started. On the SPX weekly chart that I have posted before, I had drawn a potential A-B-C pattern for a wave (4) that could go as high as 1083, but I am beginning to question this labeling. The fact that the index went beyond 875 before correcting is one reason. Another, is the reading of certain intermediate indicators. If the original count is incorrect, it can give way to at least 2 other valid counts but, for now, I will stay with the original until I have a little more proof that it has been altered.
The recent rally, fed to some extent by optimistic talk from the Fed and the Administration, and some improving fundamental statistics -- like the last unemployment report which showed the loss of ONLY 539,000 jobs in April (Wow!) has, as we will see, quickly driven sentiment from one end of the spectrum to the other. The consensus is now that we will have a small correction followed by an extension of the rally, but perhaps this is the time when we should pick the worst possible scenario instead. The reading of the sentiment indicator that I follow has not been affected by a 50 point correction of the 260 point rally. Sentiment is still much too optimistic and suggests that we may be at the beginning of a larger decline.
On the other hand, we do not have readings in all indicators that suggest that an important top has been made. So let's pick a middle course and expect a bigger retracement, but not to a new low right away. As a matter of fact, instead of speculating beyond our present technical means, let's just let the market reveal its path -- as it always does when it is good and ready. For now, we'll just call this a short-term decline and reserve the option to change that labeling in the future.
What's ahead?
Chart Pattern and Momentum
I constantly have to remind myself that I can make my analysis of the stock market as simple or as complicated as I want. Simply using trend lines on the index and on the indicators, as well looking for divergence which precedes the breaking of these trend lines is a fairly simple and highly effective technique which works well on all time frames. In the past few days, I have focused on refining this technique and noticed some repetitious indicator patterns that bring about pretty amazing results. Like everything else, there are times when the market trend will make this type of analysis more difficult than others, but this is not one of them! Let's look at the daily SPX chart.
On this chart, you can see that this technique has given four important buy and sell signals in the past five months, with the last one being a sell signal, five days ago. The next buy signal will come when the index and the indicators have completed the next meaningful pattern.
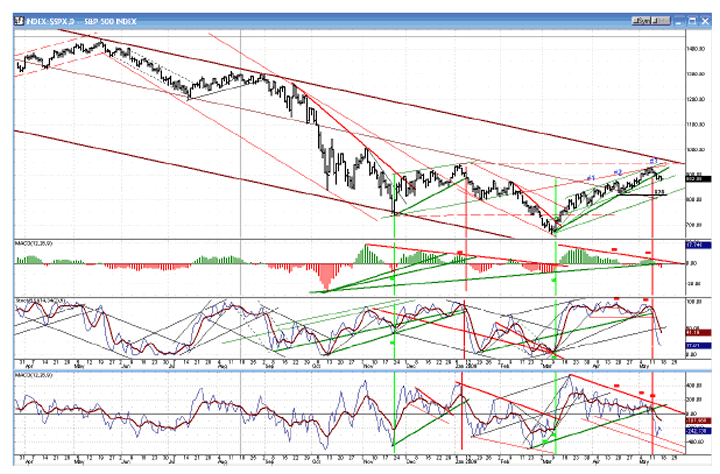
Besides the sell signal given by the technique discussed above, we had also come a little shy of reaching a projection of about 931-32 which had been given earlier to subscribers. At the same time, the index also met with a resistance line created by the extension of a former broken support line . On the chart, you can see it as the green trend line which starts on 11/21 and is penetrated on 2/17. Its extension is shown as a red resistance line.
The green trend line which, when it was broken, gave the sell signal is the third "fan" line drawn from the 667 low. Breaking the 3rd fan line frequently leads to a reversal of the trend.
The entire pattern from 667 is wedge-shaped as, also, were the two preceding patterns. Wedge patterns are not sustainable and need to evolve into a pattern that is, if they are to continue their basic trend. Before they do, they will normally retrace to the parallel of the top trend line drawn from the start of the move (667). Currently, the rising bottom channel line is at about 830. There is also former support at 828.
We'll now look at the weekly chart. The price is turning down before it touches the top channel line which is currently at about 950. I think that we can pretty much assume that in this overbought state, it would be difficult for the index to penetrate that level if there was an attempt at continuing the rally.
The weekly oscillator has not given a sell signal yet, but unless there is a strong rally next week, it probably will. The small red rectangle indicates that there is only minor negative divergence showing. A similar condition existed in May of last year, but the small divergence did not prevent the beginning of a very large decline. So the lack of important divergence is not necessarily an argument against making an important top, especially considering the overbought state of the indicator, and considering the fact that it has turned down and is about to break its uptrend lines.
Next is the hourly chart. Here, I show some of the cycles that have been discussed the past few weeks. These are only small conventional cycles which are useful in predicting short-term market reversals. However, collectively, I had expected them to bring about more weakness by now. The last one that I have marked is the 9-mo cycle which should bottom during the coming week. The pink horizontal lines are the projections that were made for the low. The first one, at 880 was reached on Friday. The second one of about 874-5 may not be reached because of all the positive divergence showing in the hourly indicators, and their readiness to give a buy signal.
Let's look at those. The bottom one, is the A/D oscillator, and this is where it shows up the most. It was still going down at the close on Friday, but a positive opening would probably turn it up.
The one above is the momentum index and, using the technique described earlier on the daily chart, you can see that it shows positive divergence, and a positive opening would also cause it to give a buy signal.
Same for the first indicator. The only hesitation is caused by the fact that there is still an unfilled projection a few points lower. Also, the bottoming of the 9-mo cycle, ideally due next week, may cause one more dip in the index. And besides, the buy signal confirmation will not come until the price trend line has been broken.
Cycles
I suspect that the 7-mo cycle might have inverted and could now bring downward pressure.
The 9-mo cycle is still due and, ideally, should make its low on the 19th. But it's a cycle which is seldom exact and could be off by a week. After it has made its low, we should have some sort of rally, and the divergence in the hourly indicators attest to this probability. But it should be short-lived, and whether or not the index makes the final high that some EW analysts expect, or just provides a test of the current high of 930 is irrelevant. There is plenty of evidence provided by the daily and weekly indicators that we should have a deeper correction than what we have had to date.
Projections:
The 880 projection (pink horizontal lines on the hourly chart) was met on Friday. There is another short-term projection lower to about 874-5 which may or may not be met before we start our rally.
On the downside, as you can see (also on the hourly chart) a .382 retracement of the rally would take us down to 828 which corresponds to the low of the big one-day paper tiger sell-off of 4/20.
I will withhold making further projections until we are certain that a top has been made, except to say that if we manage to make a new high, it could reach 950-960
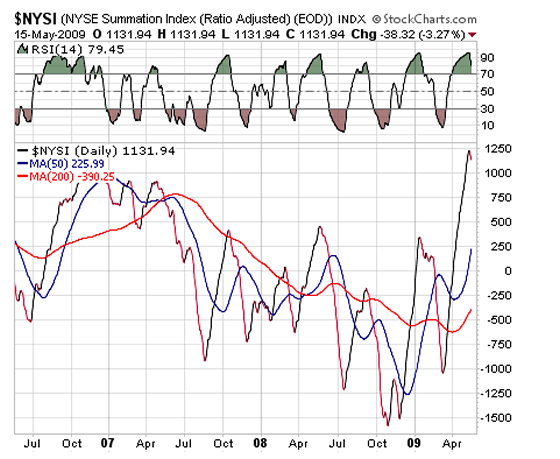
Breadth
Looking below, at the McClellan Summation Index (courtesy of StockCharts), we see that it is just beginning to correct from a very overbought position. If the RSI does what it normally does and retraces all the way down to the oversold range, the correction is just getting started.
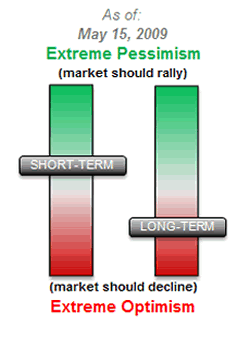
Market Leaders and Sentiment
The Sentiment indicator, below (courtesy of Sentimentrader), could not do a better job of clarifying the current market position and confirming our suspicions.
The short-term has managed to move into a barely positive condition, which gives added weight to the outlook for another short-term rally, but the long-term is still very much in the red, and will probably move even more deeply into it after the market rallies.
In other words, we could expect a short-term rally which could be the final high, or a test of the high, followed by a larger decline.
Summary
The SPX has either found a top for its rally from early March, or will do so on the next short term advance. If we simply rally to test the high and resume the decline, we will have to decide if we have found the top of wave (4) and started wave (5), or if we have only completed wave A and started B (following the pattern described on the weekly chart above) with wave C to come later.
The following are examples of unsolicited subscriber comments:
Awesome calls on the market lately. Thank you. D M
Your daily updates have taken my trading to the next level. D
… your service has been invaluable! It's like having a good technical analyst helping me in my trading. SH
I appreciate your spot on work more than you know! M
But don't take their word for it! Find out for yourself with a FREE 4-week trial. Send an email to ajg@cybertrails.com .
By Andre Gratian
MarketTurningPoints.com
A market advisory service should be evaluated on the basis of its forecasting accuracy and cost. At $25.00 per month, this service is probably the best all-around value. Two areas of analysis that are unmatched anywhere else -- cycles (from 2.5-wk to 18-years and longer) and accurate, coordinated Point & Figure and Fibonacci projections -- are combined with other methodologies to bring you weekly reports and frequent daily updates.
“By the Law of Periodical Repetition, everything which has happened once must happen again, and again, and again -- and not capriciously, but at regular periods, and each thing in its own period, not another’s, and each obeying its own law … The same Nature which delights in periodical repetition in the sky is the Nature which orders the affairs of the earth. Let us not underrate the value of that hint.” -- Mark Twain
You may also want to visit the Market Turning Points website to familiarize yourself with my philosophy and strategy.www.marketurningpoints.com
Disclaimer - The above comments about the financial markets are based purely on what I consider to be sound technical analysis principles uncompromised by fundamental considerations. They represent my own opinion and are not meant to be construed as trading or investment advice, but are offered as an analytical point of view which might be of interest to those who follow stock market cycles and technical analysis.
Andre Gratian Archive |
© 2005-2022 http://www.MarketOracle.co.uk - The Market Oracle is a FREE Daily Financial Markets Analysis & Forecasting online publication.