


Non-Existant U.S. Economic Recovery Bullish for Treasury Bonds
Interest-Rates / US Bonds May 15, 2009 - 02:06 PM GMTBy: Mike_Shedlock

 Given that Bernanke's green shoots are withering on the vine it was a sure bet that someone else would find another feel good term to describe what is essentially not happening. That term is "pre-recovery".
Please consider Treasuries Fall as Reports Show Improved Manufacturing Outlook.
Treasuries fell for the first time in three days as reports showed a manufacturing gauge contracted the least since August and U.S. industrial production fell in April, easing speculation the economic recovery was weakening.
Ten-year notes are still headed for the first weekly gain in two months, aided by two-week hiatus in Treasury debt sales and three purchases of government debt by the Federal Reserve. Yields climbed to the highest level since November last week as reports suggested the worst of the global recession may be over.
“The data says contraction is slowing,” said Andrew Richman, who oversees $10 billion in fixed-income assets as a strategist in West Palm Beach, Florida, for SunTrust Bank’s personal-asset management division. “It’s a sign of pre-recovery and it’s negative for Treasuries.”Industrial Production and Capacity Utilization
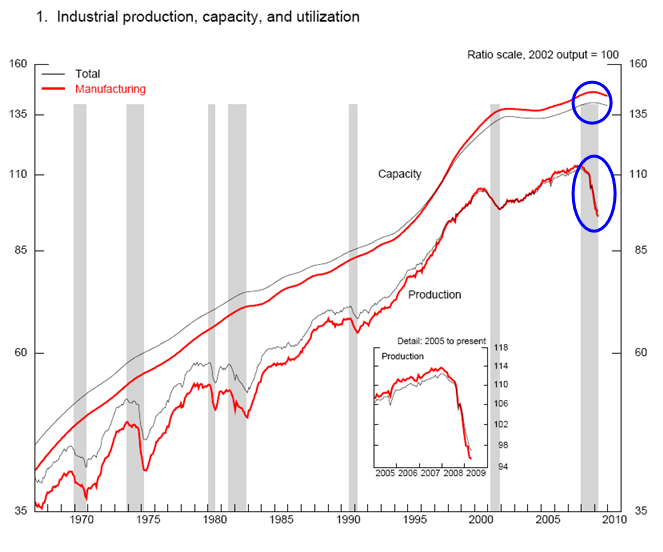
Inquiring minds are asking for a closer look at the idea of a "pre-recovery". The place to start is the Federal Reserve G.17 Industrial Production and Capacity Utilization Report.
Industrial production decreased 0.5 percent in April after having fallen 1.7 percent in March. Production in manufacturing declined 0.3 percent in April and was 16.0 percent below its recent peak in December 2007.
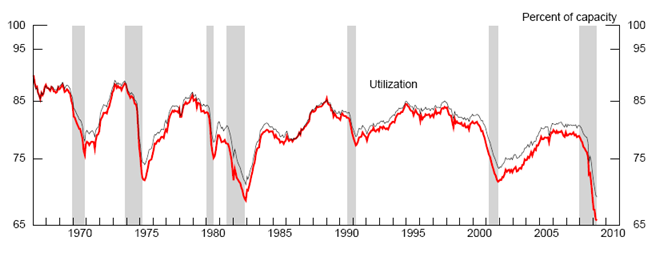
The decreases in manufacturing in April remained broadly based across industries. Outside of manufacturing, the output of mines fell 3.2 percent, as oil and gas field drilling and support activities continued to drop. The output of utilities moved up 0.4 percent. At 97.1 percent of its 2002 average, industrial output in April was 12.5 percent below its year-earlier level. The capacity utilization rate for total industry fell further in April, to 69.1 percent, a low over the history of this series, which begins in 1967.
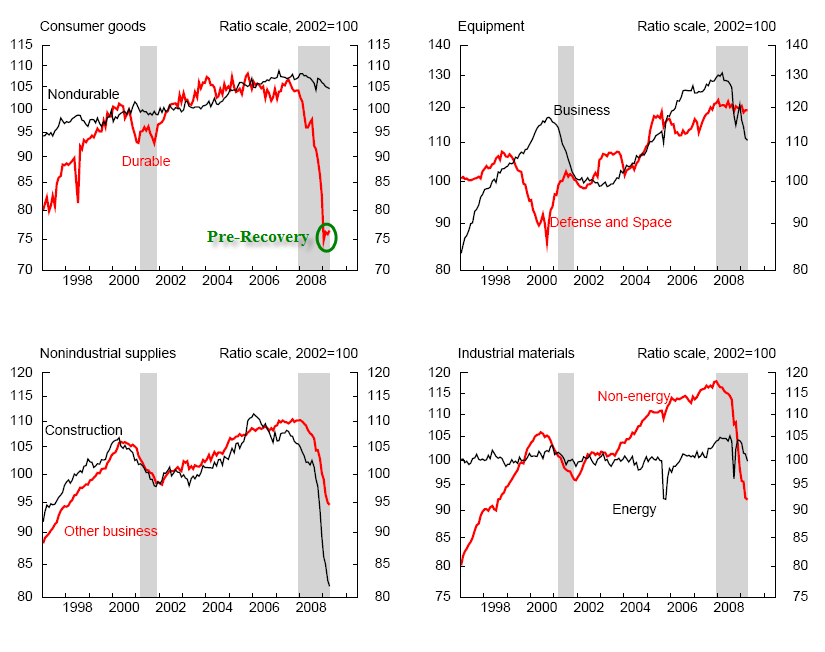
Manufacturing output declined 0.3 percent in April after falling 2.1 percent in March. The factory operating rate edged down 0.1 percentage point to 65.7 percent in April. The production index for durable goods decreased 0.3 percent, with declines in most categories partially offset by gains in the production of wood products, nonmetallic mineral products, motor vehicles and parts, and miscellaneous manufacturing. The production of nondurable goods edged down 0.1 percent. The production indexes for paper products and for petroleum and coal products advanced, but the indexes for printing and support and for apparel and leather fell substantially; output indexes for other nondurables industries were either unchanged or fell slightly. Production for the other manufacturing category, which consists of publishing and logging, fell 2.6 percent.That does not "sound" much like a "pre-recovery" so let's explore further with pictures.
Industrial Production, Capacity, and Utilization
Utilization as a Percent of Capacity
Consumer Goods, Equipment, Nonindustrial Supplies, Industrial Materials
Eureka! I've found it! There is a clear and unmistakable pre-recovery in durable goods led by motor vehicles and parts. On second thought, remember that dealers will start offering tremendous deals to clear the lots and those deals will eat into 2010 sales.
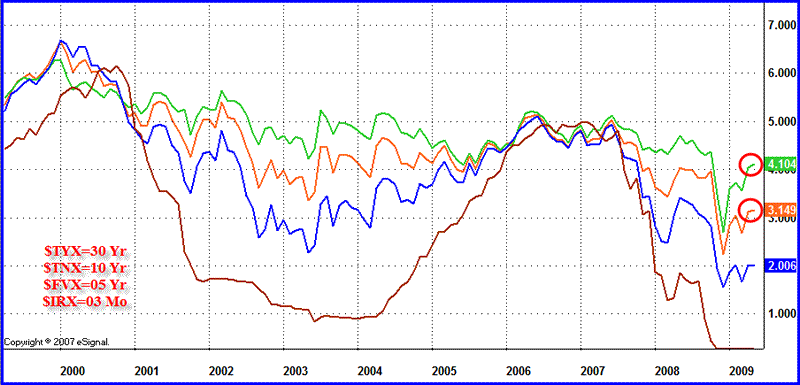
Yield Curve as of 2009-05-15
Treasuries Are A Buy
I went cautious on treasuries in December, but it's now time to become bullish again. Talk of "green shoots" and "pre-recoveries" is way overdone. Let's come back to this chart in September and October. My bet is the yield curve will be flatter and yields on the high end (10 year and 30 year) will be lower than today.
By Mike "Mish" Shedlock
http://globaleconomicanalysis.blogspot.com
Click Here To Scroll Thru My Recent Post List
Mike Shedlock / Mish is a registered investment advisor representative for SitkaPacific Capital Management . Sitka Pacific is an asset management firm whose goal is strong performance and low volatility, regardless of market direction.
Visit Sitka Pacific's Account Management Page to learn more about wealth management and capital preservation strategies of Sitka Pacific.
I do weekly podcasts every Thursday on HoweStreet and a brief 7 minute segment on Saturday on CKNW AM 980 in Vancouver.
When not writing about stocks or the economy I spends a great deal of time on photography and in the garden. I have over 80 magazine and book cover credits. Some of my Wisconsin and gardening images can be seen at MichaelShedlock.com .
© 2009 Mike Shedlock, All Rights Reserved
Mike Shedlock Archive |
© 2005-2022 http://www.MarketOracle.co.uk - The Market Oracle is a FREE Daily Financial Markets Analysis & Forecasting online publication.