


Stock Market Sentiment No Change, Continues to Point to a Top
Stock-Markets / Stock Market Sentiment May 04, 2009 - 12:31 AM GMTBy: Guy_Lerner

 There really hasn't been any change in investor sentiment, but this is not unusual at market tops, which tend to be more drawn out affairs as the discourse between bulls and bears takes on a deafening pitch.
The bulls believe the worst is behind us as stabilization in the economy will lead to growth and profits. Being the all knowing and all seeing amorphous beast that it is, the market's meteoric rise over the past 2 months can only mean one thing: there are better times ahead. We investors - of normal ability and who hail from Main Street - just don't see it. The markets always turn ahead of the economy, and this time is no different. (Editor's note: this is another piece of Wall Street dogma.)
The bears would argue that this is just a another bear market rally based upon hope. The economy remains on shaky ground, and the only thing that has changed is that the economic picture is "less bad" than a couple of months ago. The technical picture (i.e., market breadth or internals) is more consistent with a bear market rally.
Several weeks down the road, I am sure we will have our answer, and the truth -if it really matters at all- will likely lie somewhere in between. With so many voices out there, sometimes it is hard to know what we should believe.
And this is the nature of market tops. The bear market top of 2008 was a year in the making. March, 2007 was the first bearish salvo. January, 2008 was the confirmation that the bear market had begun, and May, 2008 saw a retest of the January, 2008 breakdown. This was a bull - bear discourse of epic proportion that lead to a massive deleveraging and a breathtaking fall in asset prices.
But I digress....
I think this intermediate term top will take its time to develop, and eventually unravel in the discourse of "where do we go from here?". Yes, the economy has stabilized but the risk for the bulls is this: "where do we go from here?"
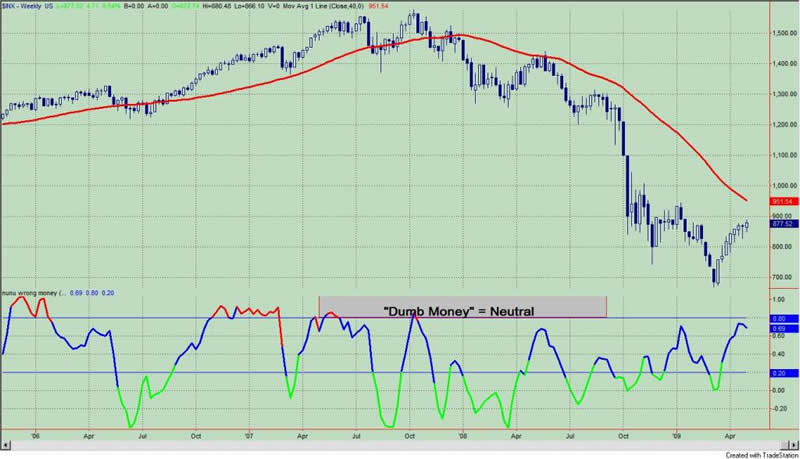
The burden of proof is with the bulls. History is with the bears. And so far it is not different this time. This is now the 7th week in a row where investor sentiment, as measured by the "Dumb Money" indicator, remains neutral. When we couple this with the fact that prices on the major stock indices remain below their 40 week moving averages, there is a high likelihood that the market will rollover in the next several weeks. When I first made this observation 2 weeks ago (see "Investor Sentiment: Time To Sell Strength And Tighten Up Stops"), the S&P500 closed the week at 869.60; this past week the S&P500 closed at 877.52. Hey, a 1% gain over the past 2 weeks works out to a 26% gain annualized and this is nothing to sneeze at. But it pails in comparison to the 20% plus gain over the prior 6 week period. The NASDAQ 100 is up almost 3% and it is sitting above its 40 week moving average. This is still within the context of a bear market rally, and I don't see anything different to suggest that it is different this time.
The "Dumb Money" indicator is shown in figure 1, and it is in the neutral zone. The "dumb money" looks for extremes in the data from 4 different groups of investors who historically have been wrong on the market: 1) Investor Intelligence; 2) Market Vane; 3) American Association of Individual Investors; and 4) the put call ratio.
Figure1. "Dumb Money"/ weekly
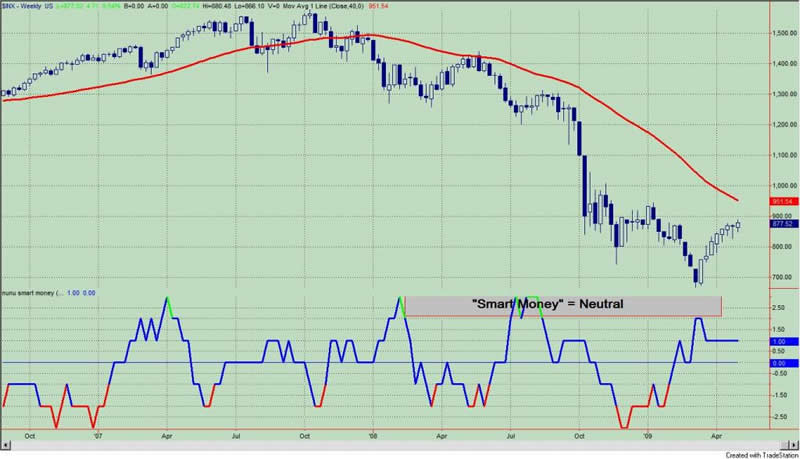
The "Smart Money" indicator is shown in figure 2 (middle panel). The "smart money" indicator is a composite of the following data: 1) public to specialist short ratio; 2) specialist short to total short ratio; 3) SP100 option traders. I have placed the "Dumb Money" indicator in the lower panel.
Figure 2. "Smart Money"/ weekly
By Guy Lerner
http://thetechnicaltakedotcom.blogspot.com/
Guy M. Lerner, MD is the founder of ARL Advisers, LLC and managing partner of ARL Investment Partners, L.P. Dr. Lerner utilizes a research driven approach to determine those factors which lead to sustainable moves in the markets. He has developed many proprietary tools and trading models in his quest to outperform. Over the past four years, Lerner has shared his innovative approach with the readers of RealMoney.com and TheStreet.com as a featured columnist. He has been a regular guest on the Money Man Radio Show, DEX-TV, routinely published in the some of the most widely-read financial publications and has been a marquee speaker at financial seminars around the world.
© 2009 Copyright Guy Lerner - All Rights Reserved
Disclaimer: The above is a matter of opinion provided for general information purposes only and is not intended as investment advice. Information and analysis above are derived from sources and utilising methods believed to be reliable, but we cannot accept responsibility for any losses you may incur as a result of this analysis. Individuals should consult with their personal financial advisors.
Guy Lerner Archive |
© 2005-2022 http://www.MarketOracle.co.uk - The Market Oracle is a FREE Daily Financial Markets Analysis & Forecasting online publication.