


Stock Market Rally Whilst Impressive is Not Sustainable
Stock-Markets / Stocks Bear Market May 03, 2009 - 06:24 AM GMTBy: Mike_Burk

 The good news is: • Friday, most of the major indices closed at their highest levels since the early March low.
Short Term - The chart below covers the past 3 months showing the NASDAQ composite (OTC) in blue and an indicator showing the percentage of the previous 4 trading days that were up in black. Dashed vertical lines have been drawn on the 1st trading of each month.
The indicator touches the top of the chart when the OTC has been up for 4 consecutive days and it touches the bottom of the chart when the OTC has been down for 4 consecutive days.
After falling Monday and Tuesday the OTC finished the week with 3 consecutive up days to finish the week at a 2 month high. Meanwhile new highs on the NASDAQ peaked at 30 on Wednesday and hit a low of 12 on Friday.
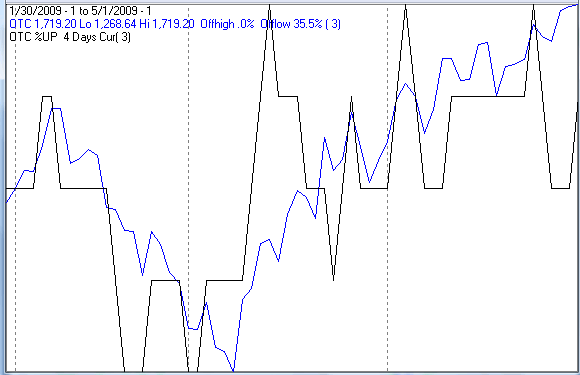
The Russell 2000 (R2K) and S&P midcap (MID) were down Thursday and Friday. If there is a broad up move in the market Monday the OTC will have been up for 4 consecutive days setting it up for a fall and it will probably take the rest of the market with it. If there is a broad move down in the Market Monday the R2K and MID will be down for 3 consecutive days for the 1st time since the early March lows and the market is likely to rally on Tuesday. The declining number of new highs at the end of last week lead me to expect Monday will be down.
Intermediate term
On March 6 there were 827 new lows on the NYSE and 567 on the NASDAQ. Those numbers are big enough to suggest a high likelihood of a retest of the March 9 lows.
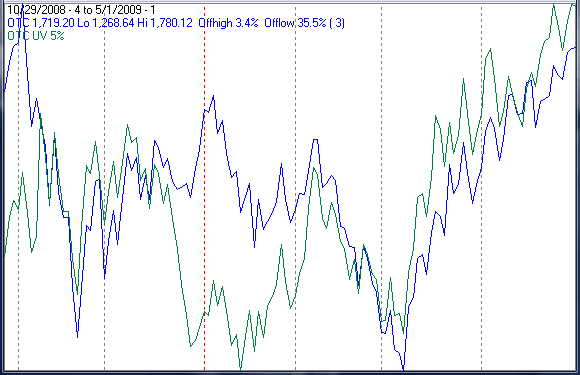
Volume of issues moving upward has been remarkable lately.
The chart below covers the past 6 months showing the OTC in blue and a 5% trend (39 day EMA) of NASDAQ upside volume (OTC UV) in green.
OTC UV hit an all time high on Friday April 24 that was matched on Thursday April 30.
For a longer term perspective, the chart below is similar to the one above except it covers the past 5 years. Dashed vertical lines have been drawn on the 1st trading day of each year.
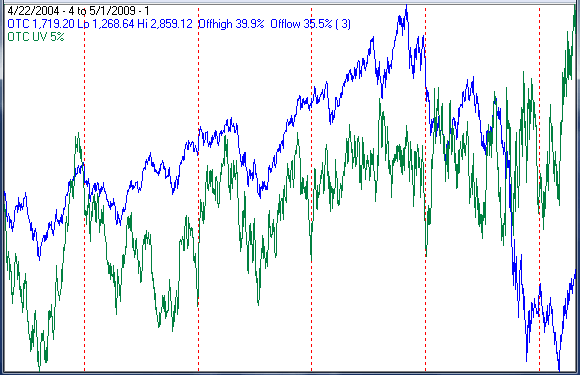
OTC UV usually deteriorates for at least a few days prior to an intermediate term high and that has not happened yet.
Seasonality
Next week includes the week prior to the 2nd Friday in May during the 1st year of the Presidential Cycle.
The tables show the daily return on a percentage basis for the week prior to the 2nd Friday of May during the 1st year of the Presidential Cycle. OTC data covers the period from 1963 - 2008 and SPX data from 1953 - 2008. Prior to 1953 the market traded 6 days a week so that data has been ignored. There are summaries for both the 1st year of the Presidential Cycle and all years combined.
The week has been modestly weak by all measures.
Report for the week before the 2nd Friday of May The number following the year is the position in the presidential cycle. Daily returns from Monday to 2nd Friday.| OTC Presidential Year 1 | ||||||
| Year | Mon | Tue | Wed | Thur | Fri | Totals |
| 1965-1 | -0.12% | -0.25% | -0.46% | 0.72% | -0.60% | -0.71% |
| 1969-1 | 0.34% | 0.19% | -0.38% | -0.02% | 0.32% | 0.45% |
| 1973-1 | -0.37% | 0.17% | -0.12% | -0.20% | -1.11% | -1.62% |
| 1977-1 | -0.14% | 0.41% | -0.25% | 0.04% | 0.46% | 0.53% |
| 1981-1 | -1.55% | -0.83% | 0.20% | 0.79% | 0.55% | -0.83% |
| 1985-1 | -0.16% | 0.37% | 0.06% | 0.78% | 1.48% | 2.53% |
| Avg | -0.38% | 0.06% | -0.10% | 0.28% | 0.34% | 0.21% |
| 1989-1 | -0.33% | -0.08% | 0.16% | 0.23% | 0.98% | 0.95% |
| 1993-1 | 0.20% | 0.04% | -0.20% | -0.89% | 0.11% | -0.74% |
| 1997-1 | 2.60% | -0.81% | -0.41% | 0.60% | 0.32% | 2.30% |
| 2001-1 | -0.82% | 1.16% | -1.92% | -1.28% | -1.01% | -3.87% |
| 2005-1 | 0.63% | -0.85% | 0.45% | -0.39% | 0.66% | 0.49% |
| Avg | 0.46% | -0.11% | -0.38% | -0.35% | 0.21% | -0.18% |
| OTC summary for Presidential Year 1 1965 - 2005 | ||||||
| Avg | 0.03% | -0.04% | -0.26% | 0.03% | 0.20% | -0.05% |
| Win% | 36% | 55% | 36% | 55% | 73% | 55% |
| OTC summary for all years 1963 - 2008 | ||||||
| Avg | -0.12% | -0.10% | -0.05% | -0.03% | 0.09% | -0.21% |
| Win% | 50% | 50% | 52% | 61% | 59% | 52% |
| SPX Presidential Year 1 | ||||||
| Year | Mon | Tue | Wed | Thur | Fri | Totals |
| 1953-1 | 1.09% | 0.12% | -0.12% | -0.40% | 0.24% | 0.93% |
| 1957-1 | -0.15% | -0.30% | 0.39% | 0.11% | 0.50% | 0.54% |
| 1961-1 | -0.17% | 0.09% | -0.09% | -0.03% | 0.09% | -0.11% |
| 1965-1 | -0.21% | -0.12% | 0.44% | 0.37% | -0.19% | 0.28% |
| 1969-1 | 0.36% | 0.47% | -0.18% | 0.41% | -0.05% | 1.01% |
| 1973-1 | -0.42% | 0.65% | -0.73% | -0.81% | -1.25% | -2.57% |
| 1977-1 | -0.31% | 0.29% | -0.69% | -0.05% | 0.30% | -0.46% |
| 1981-1 | -1.54% | -0.27% | 0.35% | 0.68% | -0.01% | -0.79% |
| 1985-1 | -0.05% | 0.43% | -0.08% | 0.72% | 1.30% | 2.32% |
| Avg | -0.39% | 0.31% | -0.27% | 0.19% | 0.06% | -0.10% |
| 1989-1 | -0.52% | -0.26% | 0.20% | 0.38% | 2.24% | 2.03% |
| 1993-1 | 0.11% | 0.35% | 0.10% | -1.25% | 0.08% | -0.62% |
| 1997-1 | 2.13% | -0.31% | -1.47% | 0.63% | 0.49% | 1.48% |
| 2001-1 | -0.24% | -0.18% | -0.45% | -0.03% | -0.76% | -1.66% |
| 2005-1 | 0.64% | -1.07% | 0.42% | -1.00% | -0.46% | -1.47% |
| Avg | 0.42% | -0.29% | -0.24% | -0.26% | 0.32% | -0.05% |
| SPX summary for Presidential Year 1 1953 - 2005 | ||||||
| Avg | 0.05% | -0.01% | -0.14% | -0.02% | 0.18% | 0.07% |
| Win% | 36% | 50% | 43% | 50% | 57% | 50% |
| SPX summary for all years 1953 - 2008 | ||||||
| Avg | -0.15% | 0.00% | -0.04% | -0.12% | 0.03% | -0.27% |
| Win% | 38% | 48% | 52% | 48% | 55% | 41% |
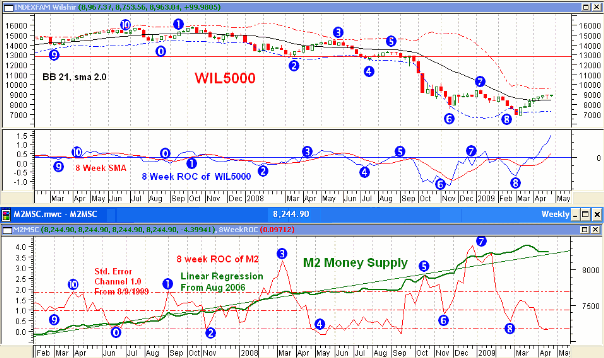
Money supply (M2)
The chart below was provided by Gordon Harms. In spite of heroic efforts by the Fed, M2 growth has been slowing.
Conclusion
The time and magnitude of the rally off the March lows has been impressive, but it has failed to generate a significant number of new highs and new highs deteriorated as the market rose during the last half of the week.
I expect the major indices to be lower on Friday May 8 than they were on Friday May 1.
Last week all of the major indices were up making last weeks negative forecast a miss.
Thank you,
By Mike Burk
To subscribe to this report : http://alphaim.net/signup.html
Gordon Harms produces a Power Point for our local timing group. You can get a copy of that at: http://www.stockmarket-ta.com/ .
Disclaimer: Mike Burk is an employee and principal of Alpha Investment Management (Alpha) a registered investment advisor. Charts and figures presented herein are believed to be reliable but we cannot attest to their accuracy. Recent (last 10-15 yrs.) data has been supplied by CSI (csidata.com), FastTrack (fasttrack.net), Quotes Plus (qp2.com) and the Wall Street Journal (wsj.com). Historical data is from Barron's and ISI price books. The views expressed are provided for information purposes only and should not be construed in any way as investment advice. Furthermore, the opinions expressed may change without notice.
Mike Burk Archive |
© 2005-2022 http://www.MarketOracle.co.uk - The Market Oracle is a FREE Daily Financial Markets Analysis & Forecasting online publication.