


Stock Market S&P 500 Index Internals
Stock-Markets / Stock Index Trading Apr 30, 2009 - 11:29 AM GMTBy: Richard_Shaw

 The S&P 500 (proxies SPY and IVV) staged an impressive rally today in the face of the worst GDP drop in 50 years for the first quarter, and the possibility of the second quarter being adversely impacted by a flu pandemic (now level 4 of 5).
Nonetheless consumer sentiment is improving in the US and Europe.
The Fed and the White House (Larry Summers) make is clear that they see the economy continuing to decline, but no longer at such a fast pace. They also project an extended period before full recovery is achieved.
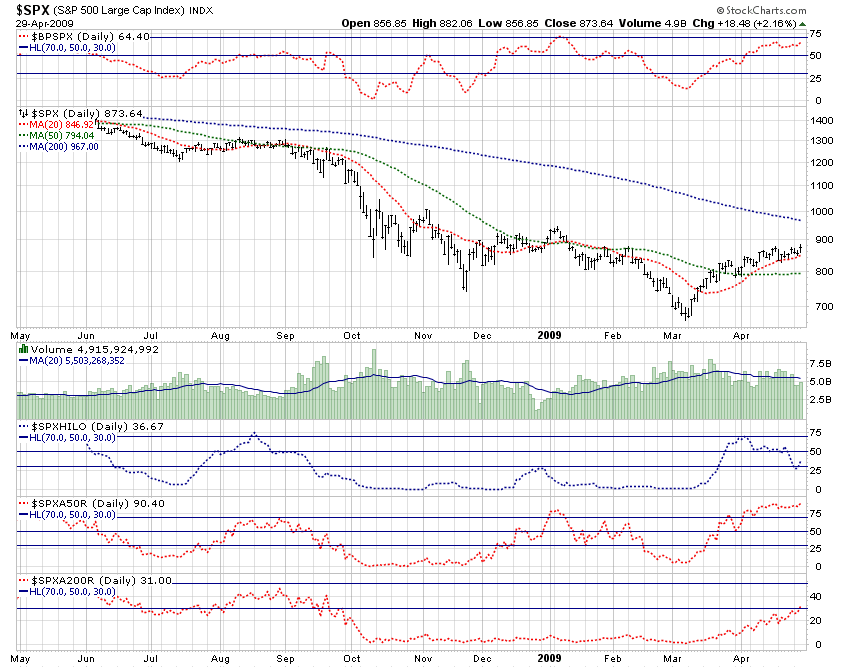
The MACD (moving average convergence divergence) in this 2-year daily chart shows fading strength to the rally, which is visible by the topping out of the trajectory of the price curve. MACD is shown as a light blue histogram behind price curve.
The share volume (shown as a green histogram below main price panel) has not been elevated during this rally, which suggests a less than full participation, which is consistent with the substantial doubt many have felt and expressed about the sustainability of the rally.
Here are some internals that you can interpret in your own way.
The top panel shows the percent of the 500 constituents with bullish point & figure charts (> 80% is considered overbought, and < 20% is considered oversold). The first panel below the price and the volume panels, shows the ratio of new highs to the total of new highs and new lows (the percentage of extremes that are positive versus all extremes). The next panel shows the percentage of constituents above their 50-day moving average. The last panel shows the percentage of constituents above their 200-day moving average (a level that per security is often referred to as a bull condition).
The index itself at 874 is below its 200-day average of 967 (10.6% higher). Many would say that if 967 is pierced, a cyclic bull is in play. The 967 level is also above most of the visible resistance from prior peaks — but the November 2008 high of about 1005 remains as a last visible hurdle.
One big problem with the concept of a cyclic bull, is that we have not touched the kind of valuation levels that are associated with major bottoms. If any time in the market would be seeing a major bottom, it should have been during this economic period.
We either are no longer in a major global economic crisis, or there is more stock market bottoming to do, if history of valuations is a guide.
By Richard Shaw
http://www.qvmgroup.com
Richard Shaw leads the QVM team as President of QVM Group. Richard has extensive investment industry experience including serving on the board of directors of two large investment management companies, including Aberdeen Asset Management (listed London Stock Exchange) and as a charter investor and director of Lending Tree ( download short professional profile ). He provides portfolio design and management services to individual and corporate clients. He also edits the QVM investment blog. His writings are generally republished by SeekingAlpha and Reuters and are linked to sites such as Kiplinger and Yahoo Finance and other sites. He is a 1970 graduate of Dartmouth College.
Copyright 2006-2009 by QVM Group LLC All rights reserved.
Disclaimer: The above is a matter of opinion and is not intended as investment advice. Information and analysis above are derived from sources and utilizing methods believed reliable, but we cannot accept responsibility for any trading losses you may incur as a result of this analysis. Do your own due diligence.
Richard Shaw Archive |
© 2005-2022 http://www.MarketOracle.co.uk - The Market Oracle is a FREE Daily Financial Markets Analysis & Forecasting online publication.