


Stock Market Seen Weakening Next Week
Stock-Markets / US Stock Markets Apr 25, 2009 - 07:21 PM GMTBy: Mike_Burk

 The good news is: Friday, the NASDAQ composite (OTC) and S&P mid cap closed at their highest levels since the early March low.
Short Term
The chart below covers the past 2 months showing the OTC in blue and an indicator showing the percentage of the previous 4 trading days that were up in black. Dashed vertical lines have been drawn on the 1st trading of each month.
The OTC was the strongest of the major indices last week and after Monday's sell off it rose for 4 consecutive days to a 2 month high, Friday. Each of the other 2 times the index was up for 4 consecutive days it has taken a hit. The 1st time March 15 the index fell 1.92% in 1 day, the 2nd time, April 3 the index fell 3.7% in 2 days.
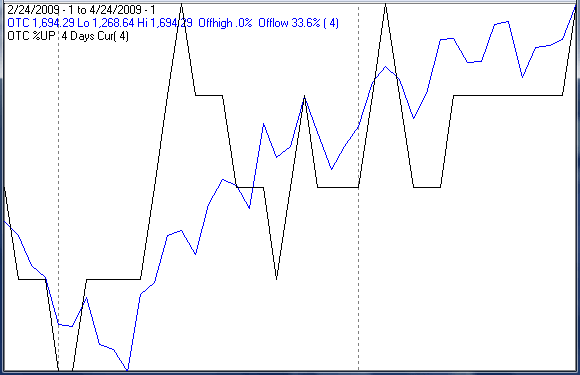
Next week, like last week is likely to see a sell off early in the week.
Intermediate term
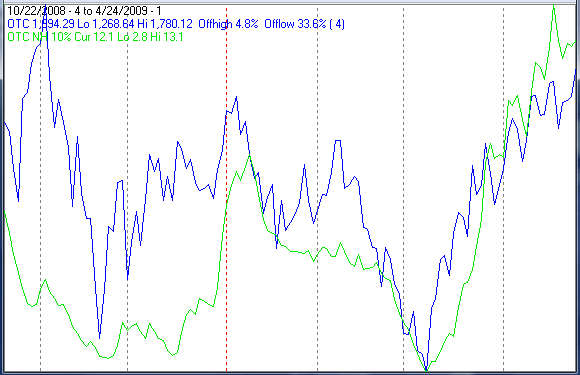
On March 6 there were 827 new lows on the NYSE and 567 on the NASDAQ. Those numbers are big enough to suggest a high likelihood of a retest of the March 9 lows.
Since the March low each successive high has been accompanied by an expansion of new highs, that pattern failed last week.
The chart below covers the past 6 months showing the OTC in blue and a 10% trend (19 day EMA) of NASDAQ new highs in green.
It has only been a week and things could change quickly, but, for now, the deterioration in new highs suggests a weakening market.
Seasonality
Next week includes the last 4 trading days of April and the 1st trading day of May during the 1st year of the Presidential Cycle.
The tables show the daily return on a percentage basis for the last 4 trading days of April and the 1st trading day of May during the 1st year of the Presidential Cycle. OTC data covers the period from 1963 - 2008 and SPX data from 1928 - 2008. There are summaries for both the 1st year of the Presidential Cycle and all years combined.
The week has been strong by all measures and especially strong during the 1st year of the Presidential Cycle.
Last 4 days of April and the first day of May.
The number following the year represents its position in the presidential cycle.
The number following the daily return represents the day of the week;
1 = Monday, 2 = Tuesday etc.
| OTC Presidential Year 1 | ||||||
| Day4 | Day3 | Day2 | Day1 | Day1 | Totals | |
| 1965-1 | 0.33% 2 | 0.37% 3 | 0.56% 4 | -0.31% 5 | 0.27% 1 | 1.23% |
| 1969-1 | -0.19% 5 | 0.68% 1 | 1.06% 2 | 1.81% 3 | 0.26% 4 | 3.62% |
| 1973-1 | -1.67% 3 | 0.32% 4 | -1.20% 5 | -0.51% 1 | 0.10% 2 | -2.96% |
| 1977-1 | -0.15% 2 | 0.71% 3 | 0.28% 4 | 0.44% 5 | 0.37% 1 | 1.66% |
| 1981-1 | 0.15% 1 | -1.02% 2 | -0.65% 3 | 0.24% 4 | -0.03% 5 | -1.31% |
| 1985-1 | 0.32% 4 | 0.06% 5 | -0.71% 1 | -0.55% 2 | -0.33% 3 | -1.22% |
| Avg | -0.31% | 0.15% | -0.24% | 0.29% | 0.07% | -0.04% |
| 1989-1 | -0.11% 2 | 0.16% 3 | 0.66% 4 | 0.32% 5 | -0.02% 1 | 1.01% |
| 1993-1 | 1.03% 2 | 0.86% 3 | 0.04% 4 | 0.45% 5 | 0.80% 1 | 3.19% |
| 1997-1 | -1.53% 5 | 0.64% 1 | 2.10% 2 | 1.46% 3 | 0.77% 4 | 3.44% |
| 2001-1 | 2.14% 3 | -1.21% 4 | 2.01% 5 | 1.95% 1 | 2.46% 2 | 7.35% |
| 2005-1 | -1.20% 2 | 0.16% 3 | -1.36% 4 | 0.92% 5 | 0.36% 1 | -1.12% |
| Avg | 0.07% | 0.12% | 0.69% | 1.02% | 0.87% | 2.77% |
| OTC summary for Presidential Year 1 1965 - 2005 | ||||||
| Averages | -0.08% | 0.16% | 0.25% | 0.57% | 0.46% | 1.35% |
| % Winners | 45% | 82% | 64% | 73% | 73% | 64% |
| MDD 4/30/1973 3.04% -- 4/28/2005 2.39% -- 4/29/1981 1.66% | ||||||
| OTC summary for all years 1963 - 2008 | ||||||
| Averages | 0.01% | -0.02% | 0.11% | 0.29% | 0.32% | 0.71% |
| % Winners | 48% | 72% | 63% | 67% | 62% | 65% |
| MDD 4/30/2004 5.73% -- 4/29/1970 5.08% -- 4/29/1999 4.66% | ||||||
| SPX Presidential Year 1 | ||||||
| Day4 | Day3 | Day2 | Day1 | Day1 | Totals | |
| 1929-1 | -0.20% 5 | 0.27% 6 | -0.47% 1 | 1.61% 2 | 0.19% 3 | 1.41% |
| 1933-1 | 0.65% 3 | -0.90% 4 | 1.69% 5 | 6.26% 6 | 1.32% 1 | 9.02% |
| 1937-1 | 1.67% 2 | -2.68% 3 | 0.00% 4 | 2.75% 5 | 0.00% 6 | 1.74% |
| 1941-1 | -0.11% 6 | 0.32% 1 | 0.21% 2 | -1.38% 3 | -0.11% 4 | -1.06% |
| 1945-1 | -0.20% 4 | 0.41% 5 | 0.61% 6 | 0.34% 1 | -0.34% 2 | 0.82% |
| Avg | 0.36% | -0.52% | 0.41% | 1.92% | 0.21% | 2.39% |
| 1949-1 | 0.00% 3 | -0.47% 4 | 0.14% 5 | 0.20% 6 | 0.27% 1 | 0.14% |
| 1953-1 | 0.58% 1 | 0.74% 2 | 0.65% 3 | -0.24% 4 | 0.45% 5 | 2.17% |
| 1957-1 | -0.35% 4 | -0.13% 5 | 0.51% 1 | 0.02% 2 | 0.61% 3 | 0.66% |
| 1961-1 | 1.40% 2 | 0.38% 3 | -0.14% 4 | -0.23% 5 | -0.21% 1 | 1.20% |
| 1965-1 | 0.17% 2 | -0.04% 3 | -0.08% 4 | 0.20% 5 | 0.13% 1 | 0.38% |
| Avg | 0.36% | 0.09% | 0.22% | -0.01% | 0.25% | 0.91% |
| 1969-1 | 0.44% 5 | 0.30% 1 | 0.74% 2 | 0.88% 3 | -0.17% 4 | 2.20% |
| 1973-1 | -1.50% 3 | 0.51% 4 | -1.52% 5 | -0.24% 1 | 0.12% 2 | -2.64% |
| 1977-1 | -0.04% 2 | 0.88% 3 | 0.24% 4 | 0.24% 5 | 0.50% 1 | 1.82% |
| 1981-1 | 0.25% 1 | -0.85% 2 | -0.95% 3 | -0.18% 4 | -0.07% 5 | -1.80% |
| 1985-1 | 0.64% 4 | -0.68% 5 | -0.85% 1 | -0.44% 2 | -0.81% 3 | -2.15% |
| Avg | -0.04% | 0.03% | -0.47% | 0.05% | -0.09% | -0.51% |
| 1989-1 | -0.63% 2 | 0.06% 3 | 0.86% 4 | 0.02% 5 | -0.17% 1 | 0.15% |
| 1993-1 | 1.03% 2 | 0.00% 3 | 0.20% 4 | 0.30% 5 | 0.52% 1 | 2.04% |
| 1997-1 | -0.75% 5 | 0.99% 1 | 2.73% 2 | 0.92% 3 | -0.35% 4 | 3.53% |
| 2001-1 | 1.59% 3 | 0.47% 4 | 1.50% 5 | -0.29% 1 | 1.36% 2 | 4.64% |
| 2005-1 | -0.89% 2 | 0.40% 3 | -1.14% 4 | 1.19% 5 | 0.46% 1 | 0.02% |
| Avg | 0.07% | 0.38% | 0.83% | 0.43% | 0.36% | 2.08% |
| SPX summary for Presidential Year 1 1929 - 2005 | ||||||
| Averages | 0.19% | 0.00% | 0.25% | 0.60% | 0.19% | 1.21% |
| % Winners | 50% | 65% | 60% | 65% | 55% | 80% |
| MDD 5/1/1985 2.76% -- 4/30/1973 2.75% -- 4/28/1937 2.68% | ||||||
| SPX summary for all years 1928 - 2008 | ||||||
| Averages | 0.08% | -0.13% | -0.07% | 0.30% | 0.09% | 0.25% |
| % Winners | 58% | 50% | 48% | 60% | 54% | 60% |
| MDD 5/2/1932 8.45% -- 4/29/1936 6.82% -- 5/2/1938 4.86% | ||||||
May
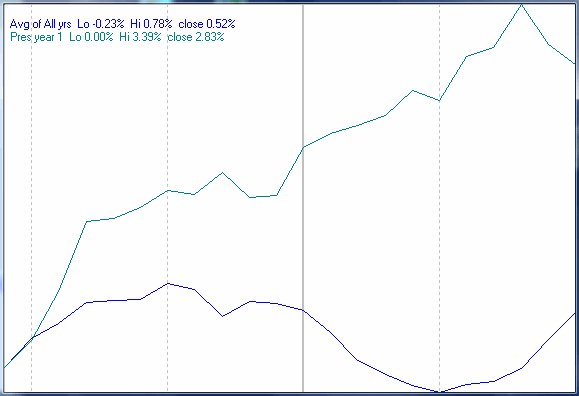
Since 1963, over all years the OTC in May has been near the middle of monthly performance averages, up 57% of the time with an average gain of 0.5%. However, during the 1st year of the Presidential Cycle May has been up 64% of the time with an average gain of 2.1% putting it 3rd behind October an April.
The average month has 21 trading days. The chart below has been calculated by averaging the daily percentage change of the OTC for each of the 1st 11 trading days and each of the last 10. In months when there were more than 21 trading days some of the days in the middle were not counted. In months when there were less than 21 trading days some of the days in the middle of the month were counted twice. Dashed vertical lines have been drawn after the 1st trading day and at 5 trading day intervals after that. The line is solid on the 11th trading day, the dividing point.
The blue line shows the average of all years since 1963 while the green line shows the average during the 1st year of the Presidential Cycle.
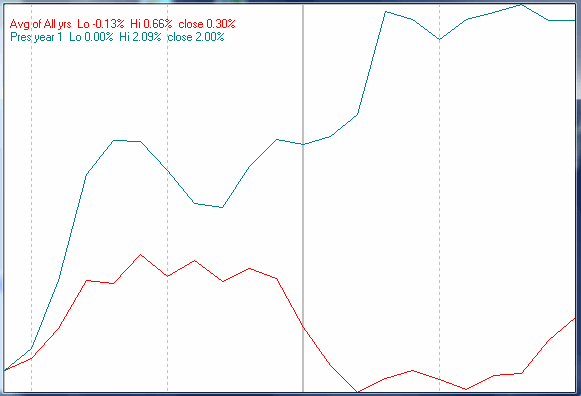
Since 1928 the SPX has been up 56% of the time in May with an average loss of 0.2% putting it ahead of February as the worst month of the year. During the 1st year of the Presidential Cycle the SPX has been up 50% of the time with an average gain of 1.3% putting it about in the middle of monthly performance figures.
The chart below is similar to the one above except it shows the daily performance over all years of the SPX in May in red and the performance during the 1st year of the Presidential Cycle in green.
Conclusion
The market appears to be weakening.
I expect the major indices to be lower on Friday May 1 than they were on Friday April 24.
Last week most of the major indices were down slightly while the OTC and Mid caps were up slightly so I am calling last weeks negative forecast a tie.
Thank you,
By Mike Burk
To subscribe to this report : http://alphaim.net/signup.html
Gordon Harms produces a Power Point for our local timing group. You can get a copy of that at: http://www.stockmarket-ta.com/ .
Disclaimer: Mike Burk is an employee and principal of Alpha Investment Management (Alpha) a registered investment advisor. Charts and figures presented herein are believed to be reliable but we cannot attest to their accuracy. Recent (last 10-15 yrs.) data has been supplied by CSI (csidata.com), FastTrack (fasttrack.net), Quotes Plus (qp2.com) and the Wall Street Journal (wsj.com). Historical data is from Barron's and ISI price books. The views expressed are provided for information purposes only and should not be construed in any way as investment advice. Furthermore, the opinions expressed may change without notice.
Mike Burk Archive |
© 2005-2022 http://www.MarketOracle.co.uk - The Market Oracle is a FREE Daily Financial Markets Analysis & Forecasting online publication.