New Stock Market and Commodities Bubbles Brewing in Shanghai and Wall Street
Stock-Markets / Financial Markets 2009 Apr 14, 2009 - 06:48 PM GMTBy: Gary_Dorsch
 After Shocks from the October Meltdown, - October is famous for stock markets crashes, - the Crash of 1929, “Black Monday” 1987, the Asian Contagion crash in October 1997, and the Sub-Prime crash of October 2008. US Treasury chief Henry Paulson’s ill-fated decision on Sept 14th, to pull the plug on the 158-year old brokerage firm of Lehman Brothers, set in motion a horrific chain of events that unleashed a torrent of panic selling on commodity and global stock markets, froze the European and US banking systems, and changed the direction American politics for years to come.
At its lowest point in October 2008, the meltdown in equities around the world erased $12 trillion of market value for the month and $31 trillion from a year earlier.Lehman’s bankruptcy left sellers of credit default swaps with liabilities of $270 billion, and hedge-funds scrambled to raise cash by selling anything they could get their hands on, including commodities and stocks. The Reuters/Jefferies Commodity Index plunged -23% in October, its steepest monthly decline since 1956. Investment grade corporate bonds lost -7.4% in October, their worst month since 1976.
At the same time, US-home prices continued their unrelenting slide for a 20th straight month, to stand -222% below their peak in July 2006. Falling US-home prices have reduced homeowner wealth by about $3 trillion, and stock market losses add-up to an additional $8-trillion. This reduced household wealth could force US-households to cut aggregate spending by $300-billion a year or more.
Historically, September is the cruelest month for the US-stock market, but residual selling often spills over into October.The Dow’s loss of -18% in October-2008 was the biggest since the crash of October-1987. Paper losses totaled $2.5 trillion. But for Republican nominee John “Maverick” McCain, a late October to Nov 4th rally, boosting the market by 15%, was too-little, too-late. The tide of opinion among the investor class whose 401k’s and IRA’s had plummeted, tilted against the Republicans, and was made worse by the unrelenting slide in home prices.
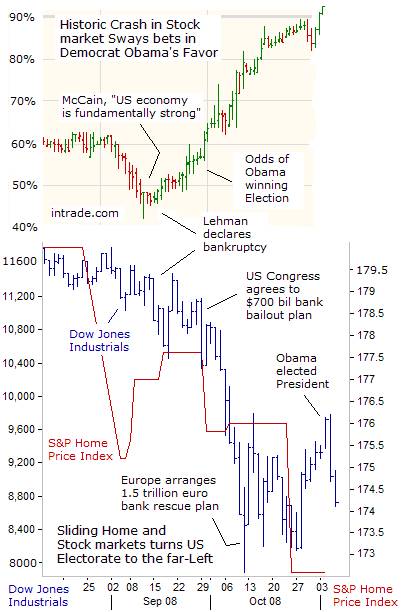
In mid-September, Republican nominee John “Maverick” McCain understood the fatal impact of a stock market meltdown on his presidential bid. He frantically suspended his campaign in order to persuade rebellious House Republicans to quickly agree to a $700-billion rescue plan for US-banks, and prevent a meltdown in the market. But House Republicans decried it as a “bailout” and helped to kill its first version, sending the Dow into a tailspin of 777-points. But Obama stayed quiet and above the fray.
The Treasury’s bail-out, - purchasing toxic mortgage-backed securities from banks was badly flawed and utterly rejected by the marketplace. Even after the House finally passed the bill on October 3rd, the Dow Jones Industrials plunged another 3,000-points and free-falling to a five-year low. It was not until the British and Euro-zone governments moved aggressively to inject capital directly into their banks, and the US Treasury followed suit, did some measure of calm and stability return to the global stock markets. But for “Maverick” McCain, the collateral damage from the October market meltdown torpedoed his long-shot bid for the presidency.
The Dow Jones Industrials rallied 15% in the week prior to Nov 4th election results, a move that has surprised many traders. Barack Obama’s higher tax policies combined with far-left Democratic control of Congress defied the conventional wisdom that markets like lower taxes and at least some gridlock on Capitol Hill. However, soon after Obama’s victory speech in Chicago, the stock market rally fizzled out, and the Dow began melting down 800-points over the next 36-hours of trading.
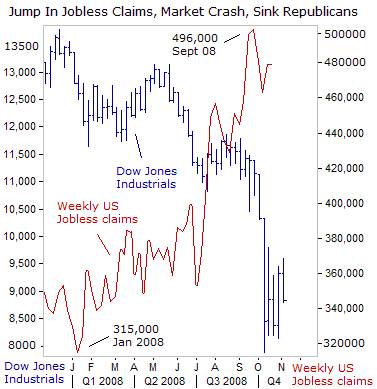
McCain had a steep uphill climb, tied to an expensive war in Iraq, linked to an deeply unpopular Republican president, 760,000-jobs lost this year before the stock market crash began in mid-September, roughly 90% of Americans saying the economy is on the wrong track, and his selection of Sarah Palin as his running mate, turned off 60% of independent voters. The Arizona senator was also handicapped by his confessions that economics wasn’t his strongest suit, which showed during the debates, while the Main Stream Media elite gave its blessings to Barack Obama.
Americans are naturally eager for fresh start, - a “New Deal,” as is typical during periods of economic hardship. And a majority of voters turned to Obama in a giant leap-of-faith, - a man who many Americans know little about, and with no executive experience, after less than four-years out of the Illinois Senate. McCain tried to paint Obama as a tax-raising Socialist, who will “spread the wealth around,” a fear that resonates with the biggest and most powerful traders in the financial markets.
Uncertainty over how Obama and the far-left Social Democrats in Congress would alter tax policies for US-multinationals listed on the NYSE, and capital gains taxes on wealthy investors, intensified the stock market’s meltdown in October. On corporate taxes, Obama proposes to tax world-wide income earned by American multi-nationals at the 35% US-corporate rate, the world’s second highest. Obama is also promising a windfall profits tax on oil companies, and in his stump speeches, talked about lifting the capital gains tax on wealthy investors to 20% next year.
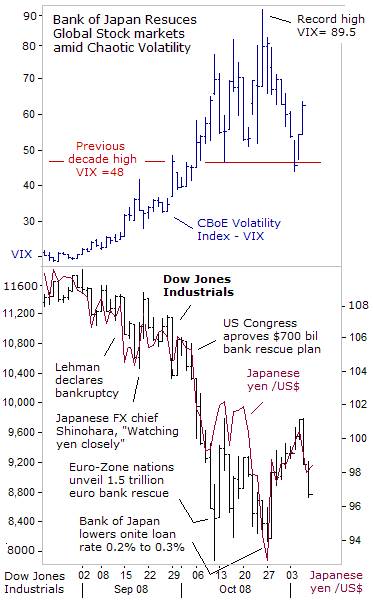
The volatility on Wall Street was unprecedented in October, with gut-wrenching swings of 500-points or more per day. The CBoE’s Volatility Index (VIX), which measures how much traders are willing to pay for stock options, typically at-the-money S&P-500 index put-options, soared to a high of 89.5 on October 24th. Even in the biggest panics this decade, the VIX did not move above 48. The VIX tends to go up during sharp market declines, and falls during sideways or rising markets.
Most importantly, the VIX is regarded as a contrarian indicator. Historically super-high VIX readings signal extreme fear and panic, and have coincided with significant bottoms in the stock market. On October 25th, contrarians lifted the Dow nearly 900-points higher, betting the fourth worst bear-market in history had run its course. The 2000-2002 bear market fell -49% before finding a bottom and the 1973-1974 bear market lost -48-percent.After the 2007-2008 bear-market tumbled -46% from the October 2007 high, contrarians figured that the trading patterns of the past would once again, serve as a reliable guide for the future.
The “Group of Seven” cartel of central bankers and the Bank of Japan played a key role in engineering the late October stock market surge, by capping the rise of the Japanese yen against other major foreign currencies. On Oct 26th, the G-7 central bankers issued a veiled threat to intervene in the marketplace if necessary, to block the yen’s advance, “We are concerned about the recent excessive volatility in the exchange rate of the yen and its possible adverse implications for economic and financial stability,” the G-7 finance officials said.
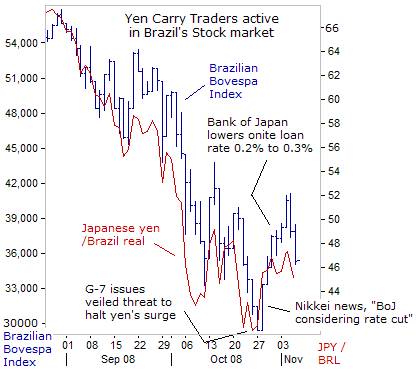
The next day, Japanese Finance chief Shoichi Nakagawa warned that Tokyo financial warlords were “watching the foreign exchange market with great interest,” secret code words for intervention to weaken the yen. Within 48-hours, the Euro had surged 10-yen to 125-yen, and the US-dollar rebounded from a 13-year low of 91-yen to as high as 99.70-yen. The unwinding of “yen carry” trades, that has been terrorizing the global stock markets since the Lehman bankruptcy, was successfully brought under control by the G-7 central bankers.
However, threats of intervention can’t suppress the yen forever, in a market where roughly $550-billion changes hands each day. Tokyo backed-up its verbal intervention threat by pressuring the Bank of Japan to cut its overnight loan rate to 0.30-percent.Currency traders hadn’t been expecting a BoJ rate-cut and quickly scrambled to cover short dollar positions towards 100-yen.
The Brazilian real also rebounded against the yen, a key catalyst that ignited a +30% rebound in the Sao Paulo’s Bovespa Index. Emerging stock markets in Asia and Latin America soared after the Federal Reserve swapped $30 billion with Brazil, Mexico, South Korea and Singapore to bolster their foreign currency reserves. Brazil’s government is struggling to prop up its currency, which has already lost a third of its value against the Japanese yen.
Brazil said it would put a quarter of its $210 billion of foreign exchange reserves on the line to defend the real. Brazil’s central bank has spent $40 billion in foreign exchange interventions so far, Brazil’s central banker President Henrique Meirelles said on Nov 6th, adding that the worst of the crisis has already passed.
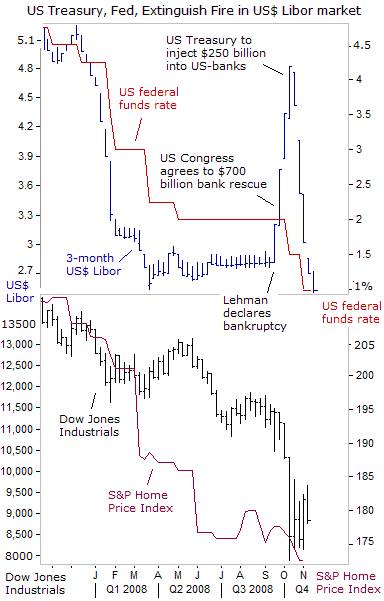
Preventing unwinding of “yen carry” trades was only one juggling-act performed by the US Treasury’s “Plunge Protection Team” in late-October. There was also the job of snuffing-out the surge in US$ Libor interest rates, to which $360-billion of adjustable rate home loans, ARM’s, and many business loans are pegged. After adopting the more sensible European approach, the US Treasury began injecting $250-billion directly into US-banks, and over the next 20-days, the 3-month US-dollar Libor rate quickly fell by 242-basis points to 2.40% today.
The flood of US dollar liquidity pumped into the global banking system by the Fed, together with aggressive interest rate cuts around the world, have calmed the panic and eased the worst of the credit crisis. Libor rates in England and the Euro-zone have declined by 70-basis points respectively, signaling that the $3.2-trillion of emergency funds approved by governments may be thawing out credit markets.
Still, until US-home prices stop falling, the S&P-500 Index is skating on very thin ice. The average US-home price might fall another 10% in the year ahead to get back to pre-bubble levels. Worse yet, home price declines can overshoot on the downside, which would increase the number of sub-prime homeowners with negative equity, and create a strong incentive to default on their mortgages. And in a vicious cycle, more foreclosures put more homes on the market, driving prices even lower, increasing bank losses. That’s why powerful stock market rallies, engineered by bargain hunters and central bankers, have typically ended-up as bull-traps.
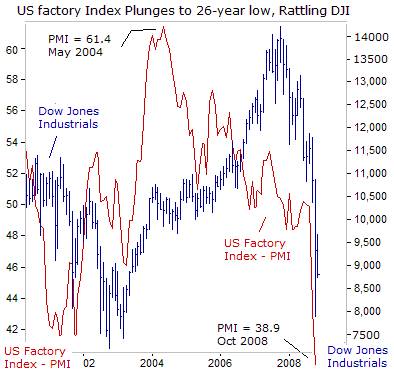
The stunning collapse the US-industrial sector in the past two months was a bombshell that shook the ground beneath the Republican Party. The ISM’s factory activity index plunged -20% over the past two months alone, to a reading of 38.9 in October, it’s lowest since September 1982. The purchasing managers’ gauge of new factory orders plunged to 32.2, the lowest since 1980, from 38.8 the prior month, and exports, theone bright spot for the US-economy this year, also collapsed, with the ISM’s export gauge dropping to 41, the lowest reading since 1988.
US auto sales plummeted -32% in October to the lowest since January 1991, led by General Motors’ 45% slide, as reduced access to car loans and a weaker economy kept consumers off dealer lots. With credit drying up and new-vehicle sales slumping, 700 car dealerships will close this year, and taking with them an estimated 37,100 jobs. That’s a heavy blow to the US economy. The country’s 20,700 dealerships accounted for $693 billion in sales last year, or 18% of all retail sales. Dealership wages and salaries make up 13% of the nation’s retail payroll.
However, bargain hunters in badly battered blue-chip stocks, are betting the ISM Factory Index has hit rock-bottom, will recover in the months ahead, perhaps with a V-shaped pattern. The risk for bottom pickers however, is the possibility that the chart pattern for the ISM factory indexes, will evolve into an L-shape pattern, or a prolonged period of stagnation at deeply depressed levels in the months ahead. Worse yet, the ultimate bottom might be located at lower levels.
Synchronized Slide in Global Economies and markets
 Despite all the adverse problems in the housing and banking sectors, that froze credit markets, toppled banks and brokers, and wreaked havoc with stock markets, the Republican ticket was still within the margin of error in mid-September. However, during the presidential debates, McCain failed to point-out that foreign stock markets in Asia, Europe, and Latin America were also melting down by 50% or more, and factory indexes overseas had fallen-off a cliff to multi-year lows. Highlighting the synchronization of global economies and markets, might have helped McCain deflect some of the blame for the economic downturn.
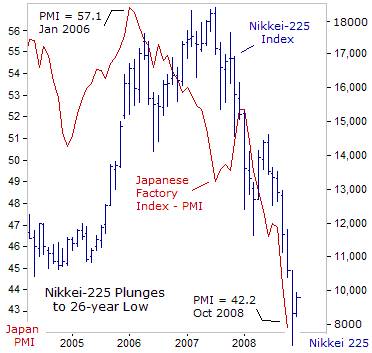
In Japan, the Nikkei-225 index plunged to its lowest in 26-years in late-October, shedding 60% from a year earlier, and handing investors’ $2.5-trillion of losses. Japan’s factory activity index plunged to the 42.2-level in October, far below the 50-mark dividing growth from contraction for the eighth straight month, suggesting the worsening global slowdown has pushed Japan deeper into recession.
New export orders, a key engine of growth for Japan, fell to 37.5 from 45.4 in September, the lowest on record, after contracting for the ninth straight month. Japanese exporters are also getting battered by the stronger yen, which reduces the value of overseas profits earned in Euros or US-dollars when repatriated back into local currency. To make matters worse, Toyota, the largest Asian automaker, reported US-auto sales plunged 23% in October, from a year earlier. Honda, Japan’s second-largest automaker, said car and light truck sales fell -26% from a year ago.
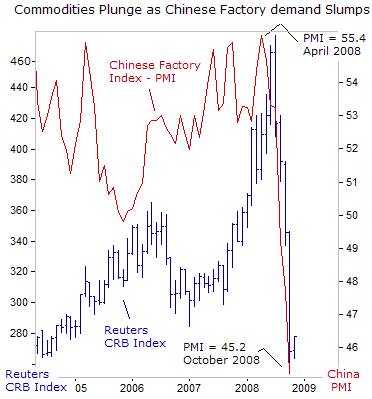
If traders are looking for China to miraculously to save the world economy, the latest signs of an economic slowdown in the Asian juggernaut are not promising. The CLSA China Manufacturers Index (PMI) showed that factory activity contracted sharply in October, falling to 45.2, its lowest level since the surveys began in June 2004. Manufacturing is a key engine of growth for China’s juggernaut economy, and accounts for about 42% of China’s gross domestic product.
 Companies from Hong Kong, Taiwan, America and Europe flooded into the Guangdong province to set up low-cost factories that made everything from sneakers to laptops and iPods. China’s vast manufacturing hub along the Pearl River Delta, has long been regarded as the world’s factory floor. However, Chinese manufacturers are now seeing their order books cut, both at home and abroad, as the world economy falls deeper into recession. For the first time in three years, the growth rate for Chinese exports in the third quarter of 2008 declined.
Government statistics show that 67,000 Chinese factories have been shut-down in the first half of this year, and another 33,000 plants will closed by year’s end. Factory owners in China were straining under soaring labor and raw-materials costs, and an appreciating Chinese currency. When the credit crunch took hold, Western importers slashed orders for Chinese goods and bankers curtailed loans to factories, so many operations were pushed over the edge.
China has been the biggest driver of global demand for commodities this decade, including agriculture, base metals, and energy. For instance, from 2000 through 2007, China’s energy demand grew by 65%, and accounted for a third of the total increase in oil consumption around the world. One big question is what will happen to Chinese oil demand if the global economy goes into a tailspin? Given that there are 2.2 billion people in China and India, there should be plenty of demand for commodities, even if their economies slow to an average growth rate of around 7% in real dollar terms. Yet signs of “demand destruction” from China’s factories in recent months have sliced the Reuter’s Commodity Index in half.
Bank of England Pushes the Panic Button
The British pound has suddenly collapsed from a 26-year high in the summer of 2007 to a five-year low against the dollar in October, the most brutal devaluation sterling has suffered, since it was ejected from the European Exchange Rate Mechanism in 1992. Major players in London are dumping the British ounce, on expectations the Bank of England will slash its base rate to 2% next year – which would be the lowest rate in the Bank of England’s 314-year history.
Bank of England chief Mervyn King warned on October 23rd, that “the pound could face a larger and faster adjustment in the coming months as the UK economy is forced to adapt to the new post-financial crisis landscape.” He warned that the UK was facing a similar economic downturn to the Asian economies in the late 1990’s when foreign investors pull out their capital from their countries. “The drama of the banking crisis, which is unprecedented in the lifetime of almost all of us, will damage business and consumer confidence,” he warned.
Much like the bursting of the US-housing bubble, British home prices are spiraling lower. Britain’s biggest mortgage lender, Halifax, said UK house prices fell 2.2% in October, the ninth successive decline, and are -15.75 lower compared with a year ago, the steepest fall since records began in 1983. A report by Standard & Poor’s revealed that 335,000 households in Britain now find themselves in negative equity, an increase of 250,000 in only four months. By 2010, S&P predicts that as many as 2 million UK households could be threatened with falling into negative equity.
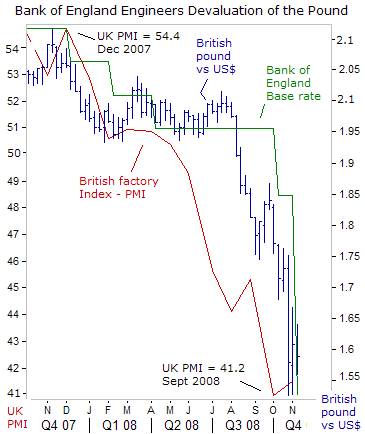
Recognizing the extreme danger to the British economy from a double barreled slide in housing and stock markets, the Bank of England delivered a shocking 1.50% cut in interest rates on Nov 6th, lowering its base rate to 3%, it’s lowest in more than half a century. The BoE judged “the economic outlook had worsened markedly because of the global financial crisis and that drastic action was needed.” However, British banks are reluctant to pass along lower mortgage rates in line with official BoE lending rates because of historically high sterling Libor rates.
British factory output also contracted for a sixth consecutive month in October as falling demand both at home and abroad tipped the sector into recession. In response, the BoE engineered the biggest devaluation of the British pound since sterling’s ejection from the EU’s Exchange Rate Mechanism in 1992, to help UK exporters compete in foreign markets, and artificially inflate the income of UK multinationals earned abroad. Despite the pound’s 24% devaluation however, the UK’s index for new export orders fell to 43.5, its lowest since September 2001.
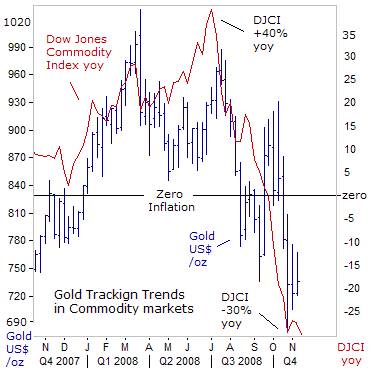
Commodity markets have been on their wildest roller-coaster ride this year, soaring amid an inflationary boom in the first half, and then plummeting in a deflationary bust in the second half. At its peak in early July, the Dow Jones Commodity Index stood +40% higher than a year earlier, led by spectacular gains in energy, grains, and precious metals. But signs of a serious worldwide recession have meant the end of the commodities boom. Gold, tracking trends in the broad commodity indexes, has tumbled 28% since a record high of $1,030 /ounce on March 17th.
Mitigating some of gold’s vulnerability to sliding commodities is its traditional role as a hedge against global security risks. US Vice-president elect Joe Biden might be right. There could be an international crisis to test the new American President in 2009. Perhaps North Korea will refuse to honor its disarmament promises, and fire up its plutonium reprocessing plant. Perhaps Iran’s Revolutionary Guard units located in Lebanon, the Gaza Strip, southern Iraq, and its “special groups” in the Persian Gulf, will become more active, once the US-military withdraws from Iraq.
Tension in Russian-American relations has been driven to a post-Cold War high by Moscow’s invasion of South Ossetia. Russian President Dmitry Medvedev wasted no time on Nov 5th, and in his first state of the nation speech, said Moscow will deploy Iskander missiles near Poland, and equipment to electronically hamper the operation of US missile defense facilities in Poland and the Czech Republic. “From what we have seen, the creation of a missile defense system, the encirclement of Russia with military bases, the relentless expansion of NATO, we have gotten the clear impression that NATO is testing our strength,” Medvedev warned.
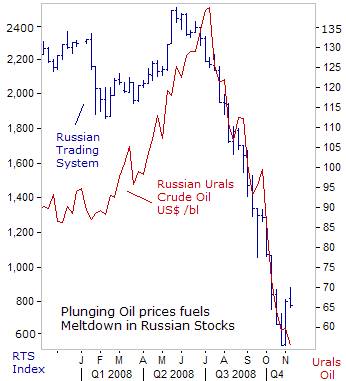 On the financial crisis, Medvedev said overconfidence in American dominance after the collapse of the Soviet Union “led the US authorities to major mistakes in the economic sphere. The American administration ignored warnings and harmed itself and others by blowing up a money bubble to stimulate its own growth,” he said. Of course, the Kremlin has also been guilty of inflating the the Russian stock market bubble, by expanding its M2 money supply an average 50% per year.
Soaring oil prices also fueled a boom in Russian stocks over the past few years, and bloated Russia’s foreign exchange reserves to a peak of $597 billion, the third-largest in the world, from just $10 billion in 1998. Four years of high oil prices have left the country with no foreign debt. But since July, sliding oil prices, concerns about the Russian banking sector, and a mass exodus of foreign investors from Russia’s stock market, has wiped-out three-quarters of the Russian Trading System Index’s value, led by Gazprom and Rosneft, the country’s biggest energy companies.
Moscow has been forced to draw-down $113-billion from its reserves to $484 billion, in order to support state-run banks with subordinated loans, to buy equities on the stock exchange, and to defend the Russian rouble in the foreign exchange market. Russian kingpin Vladimir Putin argues there is no alternative to his prescription of greater state-control over the economy and stock markets, and that the turmoil in Western capitalist economies only proves it.
Since August, the Bush-Paulson team has seized America’s largest insurance company, AIG, nationalized mortgage giants Fannie and Freddie, pumped $250 billion into US-banks, paid the $29 billion dowry for Bear Stearns to enter its shotgun marriage with JP Morgan Chase, and will soon bail-out GM, Ford and Chrysler. Is America sliding on the slippery slope towards Europe’s “Enlightened Socialism?”
This article is just the Tip-of-the-Iceberg of what's available in the Global Money Trends newsletter, for insightful analysis and predictions of (1) top stock markets around the world, (2) Commodities such as crude oil, copper, gold, silver, and grains, (3) Foreign currencies (4) Libor interest rates and global bond markets (5) Central banker "Jawboning" and Intervention techniques that move markets.
By Gary Dorsch,
Editor, Global Money Trends newsletter
http://www.sirchartsalot.com
GMT filters important news and information into (1) bullet-point, easy to understand analysis, (2) featuring "Inter-Market Technical Analysis" that visually displays the dynamic inter-relationships between foreign currencies, commodities, interest rates and the stock markets from a dozen key countries around the world. Also included are (3) charts of key economic statistics of foreign countries that move markets.
Subscribers can also listen to bi-weekly Audio Broadcasts, with the latest news on global markets, and view our updated model portfolio 2008. To order a subscription to Global Money Trends, click on the hyperlink below, http://www.sirchartsalot.com/newsletters.php or call toll free to order, Sunday thru Thursday, 8 am to 9 pm EST, and on Friday 8 am to 5 pm, at 866-553-1007. Outside the call 561-367-1007.
Mr Dorsch worked on the trading floor of the Chicago Mercantile Exchange for nine years as the chief Financial Futures Analyst for three clearing firms, Oppenheimer Rouse Futures Inc, GH Miller and Company, and a commodity fund at the LNS Financial Group.
As a transactional broker for Charles Schwab's Global Investment Services department, Mr Dorsch handled thousands of customer trades in 45 stock exchanges around the world, including Australia, Canada, Japan, Hong Kong, the Euro zone, London, Toronto, South Africa, Mexico, and New Zealand, and Canadian oil trusts, ADR's and Exchange Traded Funds.
He wrote a weekly newsletter from 2000 thru September 2005 called, "Foreign Currency Trends" for Charles Schwab's Global Investment department, featuring inter-market technical analysis, to understand the dynamic inter-relationships between the foreign exchange, global bond and stock markets, and key industrial commodities.
Copyright © 2005-2009 SirChartsAlot, Inc. All rights reserved.
Disclaimer: SirChartsAlot.com's analysis and insights are based upon data gathered by it from various sources believed to be reliable, complete and accurate. However, no guarantee is made by SirChartsAlot.com as to the reliability, completeness and accuracy of the data so analyzed. SirChartsAlot.com is in the business of gathering information, analyzing it and disseminating the analysis for informational and educational purposes only. SirChartsAlot.com attempts to analyze trends, not make recommendations. All statements and expressions are the opinion of SirChartsAlot.com and are not meant to be investment advice or solicitation or recommendation to establish market positions. Our opinions are subject to change without notice. SirChartsAlot.com strongly advises readers to conduct thorough research relevant to decisions and verify facts from various independent sources.
Gary Dorsch Archive |
© 2005-2022 http://www.MarketOracle.co.uk - The Market Oracle is a FREE Daily Financial Markets Analysis & Forecasting online publication.


