


EURUSD Technical Outlook
Currencies / Euro Jun 01, 2015 - 03:12 PM GMTBy: Austin_Galt

 Let's take a bottom up approach to the analysis beginning with the daily chart.
EURUSD Daily Chart
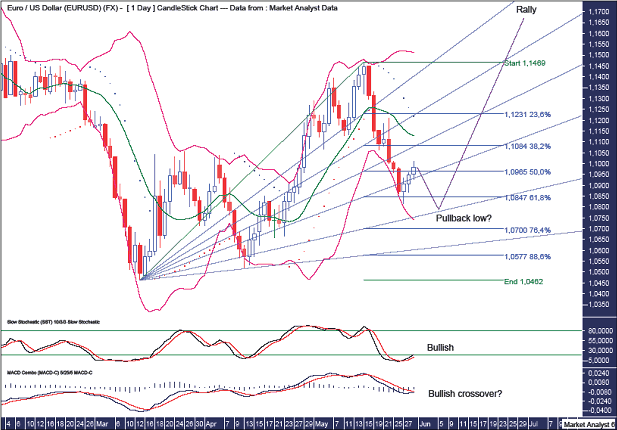
We can see the recent rally busted above the previous double top which is bullish in my opinion. We just await a higher low and this bear rally can gather some steam.
The PSAR indicator has a bearish bias with the dots above price but I suspect the move down is nearly done.
The Bollinger Bands show price has bounced off the lower band. That may be it but I favour one last lash at the lower band before the bear rally takes off.
I have added Fibonacci retracement levels of the recent move up. Previously I was targeting a move to at least the 76.4% level but I now favour the 61.8% level to bring in the low. Price has already hit this level but I think one last test around here is in order.
I have drawn a Fibonacci Fan and I am looking for the 76.4% angle to bring in the low. This looks set to occur just below 1.08 in the first half of June.
The Stochastic indicator is now bullish while the MACD indicator looks to be threatening a bullish crossover. That crossover should confirm the bear rally is on.
EURUSD Weekly Chart
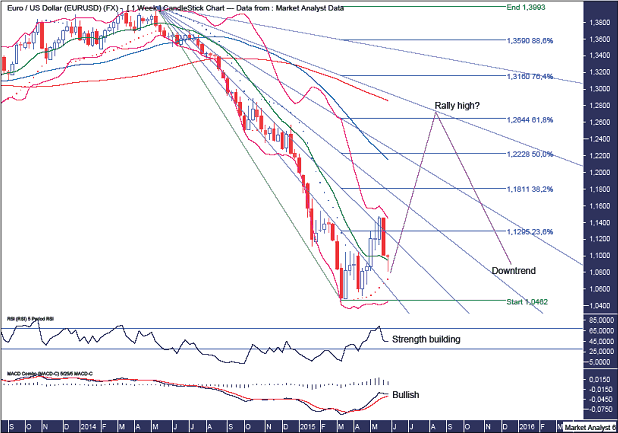
The RSI has trended up recently signifying strength is building while the MACD indicator is trending up and looking bullish.
The Bollinger Bands show price traded up to the upper band before retreating back to the middle band which may provide enough support to bring in the higher low. I favour this happening.
The PSAR indicator has a bullish bias with price now testing that support. The dots currently stand at 1.0720 and will likely be around 1.0780 next week. I am looking for this support to hold. So, considering I expect price to dip below the recent low was at 1.0815, that provides a small area of opportunity (or downside if you like) of around 35 pips. Keep in mind, I will be watching for a higher low above 1.0815 as I have an inkling I might be wrong about price dipping below last week's low.
I expect a substantial rally to develop and I am targeting the 61.8% Fibonacci retracement level of the recent major move down. That level stands at 1.2644.
Also, I have drawn a Fibonacci Fan and I am targeting the 76.4% angle to see in the rally high which looks set to occur in August/September this year just above the 61.8% level.
I have added moving averages with time periods of 50 (blue) and 100 (red) and these are ordered per the overall bear trend that dominates. I am looking for price to get back up to the red line which should act as resistance.
EURUSD Monthly Chart
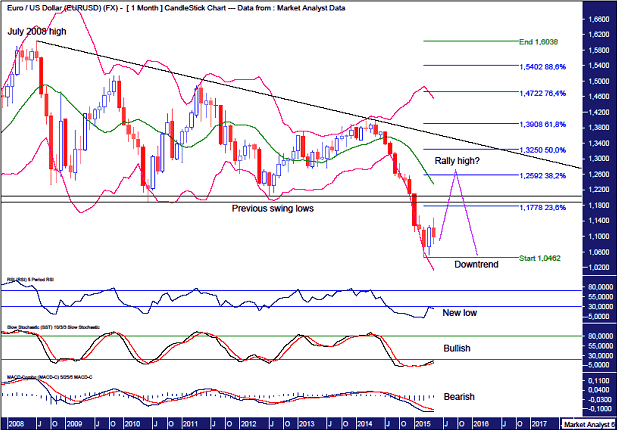
The RSI recently made a new low meaning the recent price low was very unlikely the final low which I favour to be accompanied by less weak indicator readings.
The Stochastic indicator is now bullish.
The MACD indicator is still bearish but a big rally shortly should alter that.
The Bollinger Bands show price has just left the lower band and I favour the final rally high to around resistance from the middle band.
I have drawn a couple of horizontal lines which denote previous swing lows and I expect price to rise above this resistance.
I have drawn a downtrend line from the July 2008 high and I don't expect price to trade above there. Doing so would likely signify the bear trend is over. Very unlikely in my opinion.
I have added Fibonacci retracement levels of the move down from July 2008 high to recent low and I am targeting price to clip the 38.2% level at 1.2592 to bring in the final rally high. Then the downtrend can resume.
EURUSD Yearly Chart
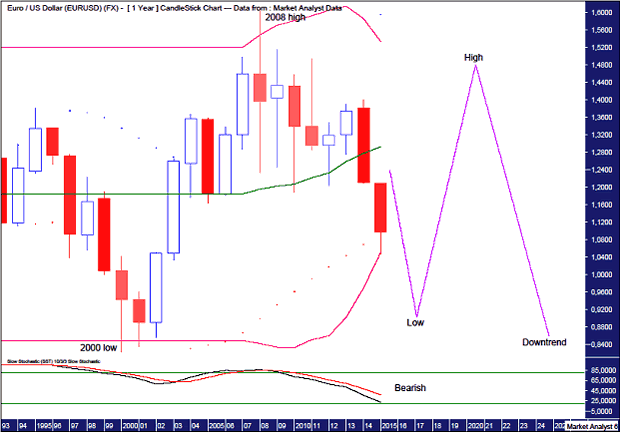
Price looks to be in a massive consolidation. Price looks headed to test the lower side of the zone where I expect support to come in. I don't expect all time lows during this current overall bear trend. Instead I expect price to then head back up to test the upside of the zone. Only after that upside test has taken place in the coming years do I expect the downtrend to resume which sees price make all time lows below 82.30. All in good time.
Price could well break out to the upside eventually but I am probably being biased due to my fundamental view that the Euro is doomed. Thinking the European countries, which have so often been at war with each other throughout the ages, could all of sudden decide to join together and be a happy family forever might be a bit wishful. Time will tell!
This year has seen price bust the support of the PSAR indicator with the dots now above price.
The Bollinger bands show price recently found support at the lower band and I expect this to lead to a significant rally. I doubt however this rally will get back to the middle band which stands just above 1.29. once this overall move down is finished, perhaps around the 90 mark I expect the move up to get back up to the upper band where it should meet resistance.
The Stochastic indicator is looking bearish signifying lower prices are likely.
Summing up, a bear rally now appears in its infancy and I expect the final rally high to come in somewhere around 1.26 later this year after which price should resume the overall down trend which sees price trade below par.
By Austin Galt
Austin Galt is The Voodoo Analyst. I have studied charts for over 20 years and am currently a private trader. Several years ago I worked as a licensed advisor with a well known Australian stock broker. While there was an abundance of fundamental analysts, there seemed to be a dearth of technical analysts. My aim here is to provide my view of technical analysis that is both intriguing and misunderstood by many. I like to refer to it as the black magic of stock market analysis.
Email - info@thevoodooanalyst.com
© 2015 Copyright The Voodoo Analyst - All Rights Reserved
Disclaimer: The above is a matter of opinion provided for general information purposes only and is not intended as investment advice. Information and analysis above are derived from sources and utilising methods believed to be reliable, but we cannot accept responsibility for any losses you may incur as a result of this analysis. Individuals should consult with their personal financial advisors.
Austin Galt Archive |
© 2005-2022 http://www.MarketOracle.co.uk - The Market Oracle is a FREE Daily Financial Markets Analysis & Forecasting online publication.